Section 2 Claudia Samples
2.1 Experiment
2.2 Metadata
2.3 OligoMM
| ID | phylum | species |
|---|---|---|
| YL44 | Verrucomicrobia | A. muciniphila |
| I48 | Bacteroidetes | B. caecimuris |
| YL27 | Bacteroidetes | M. intestinale |
| YL45 | Proteobacteria | T. muris |
| YL2 | Actinobacteria | B. longum |
| KB1 | Firmicutes | E. faecalis |
| KB18 | Firmicutes | A. muris |
| YL32 | Firmicutes | C. clostridioforme |
| YL31 | Firmicutes | F. plautii |
| YL58 | Firmicutes | B. coccoides |
| I49 | Firmicutes | L. reuteri |
| I46 | Firmicutes | C. innocuum |
2.4 Load in variants
require(data.table)
source("utils.R")
vcftodataframe <- function(vcf_files, contig_mapping = contig_mapping, gff_df = gff_df) {
    require(vcfR)
    res <- list()
    for (file in vcf_files) {
        # message(file)
        vcf_content <- vcfR::read.vcfR(file, verbose = FALSE)
        vcf_fix <- as.data.frame(vcf_content@fix)
        vcf_info <- vcfR::INFO2df(vcf_content)  # contains DP and AF info
        if (nrow(vcf_fix) > 0) {
            # there are variants
            dat <- as.data.frame(cbind(vcf_fix[, c(1, 2, 4, 5, 6)], vcf_info[, c(1, 2)]))
            dat$majorAF <- sapply(dat$AF, minorAfToMajorAf)
            dat$dp <- as.numeric(as.matrix(vcf_info$DP))
            dat$genome <- contig_mapping[match(dat$CHROM, contig_mapping$contig), ]$genome
            dat$genome_hr <- translateGenomeIdToFullName(tolower(dat$genome))
            dat$mouse.id <- substr(tools::file_path_sans_ext(basename(file)), 1, 4)
            # add studz type specific annotations
            dat$mouse.group <- designdf[match(dat$mouse.id, designdf$mouse.id), ]$desc
            dat$day <- designdf[match(dat$mouse.id, designdf$mouse.id), ]$day
            dat$generation <- designdf[match(dat$mouse.id, designdf$mouse.id), ]$generation
            dat$ecoli <- designdf[match(dat$mouse.id, designdf$mouse.id), ]$ecoli
            dat$sample <- tools::file_path_sans_ext(basename(file))
            # annotate overlay of gene
            dt_gff <- data.table(start = gff_df$start, end = gff_df$end, chr = as.character(as.matrix(gff_df$chr)),
                feature = gff_df$product)
            colnames(dat)[1:2] <- c("chr", "start")
            dat$start <- as.integer(as.matrix(dat$start))
            dat$chr <- as.character(as.matrix(dat$chr))
            dat$end <- dat$start
            dat2 <- as.data.table(dat)
            setkey(dt_gff, chr, start, end)
            annotated <- foverlaps(dat2, dt_gff, type = "within", mult = "first")
            res[[tools::file_path_sans_ext(basename(file))]] <- annotated  # add vcf df to list
        } else {
            message("Skipping")
        }
    }
    df <- as.data.frame(do.call(rbind, res))  # merge list to df
    return(df)
}
Merge vcf and annotate with metadata
# load in reference information
gff_files <- Sys.glob("data/references/joined_reference_curated_ecoli/*.gff")
gff_df <- NULL
for (gff_file in gff_files) {
    message(gff_file)
    gff <- rtracklayer::readGFF(gff_file)
    # subset since different columns are present on gff files
    relevant <- data.frame(start = gff$start, end = gff$end, type = as.character(as.matrix(gff$type)),
        gene = as.character(as.matrix(gff$gene)), product = as.character(as.matrix(gff$product)),
        chr = as.character(as.matrix(gff$seqid)))
    relevant$genome <- substr(basename(gff_file), 1, nchar(basename(gff_file)) - 4)
    gff_df <- rbind(gff_df, relevant)
}
## data/references/joined_reference_curated_ecoli/joined_reference_curated_ecoli.gff# load in contig information
contig_mapping <- read.csv2("data/contig_mapping_new_ref.csv", sep = ";", header = T, stringsAsFactors = F)
# load in vcf files
vcf_files <- Sys.glob("out_claudia/all_vcf/*.vcf")
vcf_samples <- suppressWarnings(vcftodataframe(vcf_files, contig_mapping, gff_df = gff_df))
vcf_samples$feature <- as.character(as.matrix(vcf_samples$feature))
vcf_samples[which(is.na(vcf_samples$feature)), ]$feature <- "outside ORFs"
vcf_samples$start <- NULL
vcf_samples$end <- NULL
vcf_samples$i.end <- NULL
colnames(vcf_samples)[3] <- "POS"
vcf_samples$ref_size <- nchar(as.character(as.matrix(vcf_samples$REF)))
vcf_samples$alt_size <- nchar(as.character(as.matrix(vcf_samples$ALT)))
vcf_samples$alteration <- paste(as.character(vcf_samples$REF), "->", as.character(vcf_samples$ALT))
vcf_samples$alteration_type <- "SNP"
vcf_samples[which(vcf_samples$ref_size < vcf_samples$alt_size), ]$alteration_type <- "insertion"
vcf_samples[which(vcf_samples$ref_size > vcf_samples$alt_size), ]$alteration_type <- "deletion"
saveRDS(vcf_samples, file = "data/rds/omm_claudia_new.rds") # unfiltered version2.5 Filter out of abnormal high mutation
We filter out samples that have a mutation rate of the global mean.
dat <- readRDS("data/rds/omm_claudia_new.rds")
dat <- dat[which(dat$alteration_type == "SNP"), ]
dat$dummy <- 1
# summarize by alteration type
dat.agg <- aggregate(dummy ~ alteration + sample, dat, sum)
dat.agg <- dat.agg[order(-dat.agg$dummy), ]

median_threshold <- mean(dat.agg$dummy)

p <- ggplot(dat.agg, aes(x = reorder(sample, dummy), y = dummy, group = alteration)) + ylab("number of SNPs (log10)") +
    xlab("samples")
p <- p + geom_bar(stat = "identity") + coord_flip() + facet_wrap(~alteration) + scale_y_log10()
p <- p + theme_bw() + geom_hline(yintercept = median_threshold, colour = "grey50")
print(p)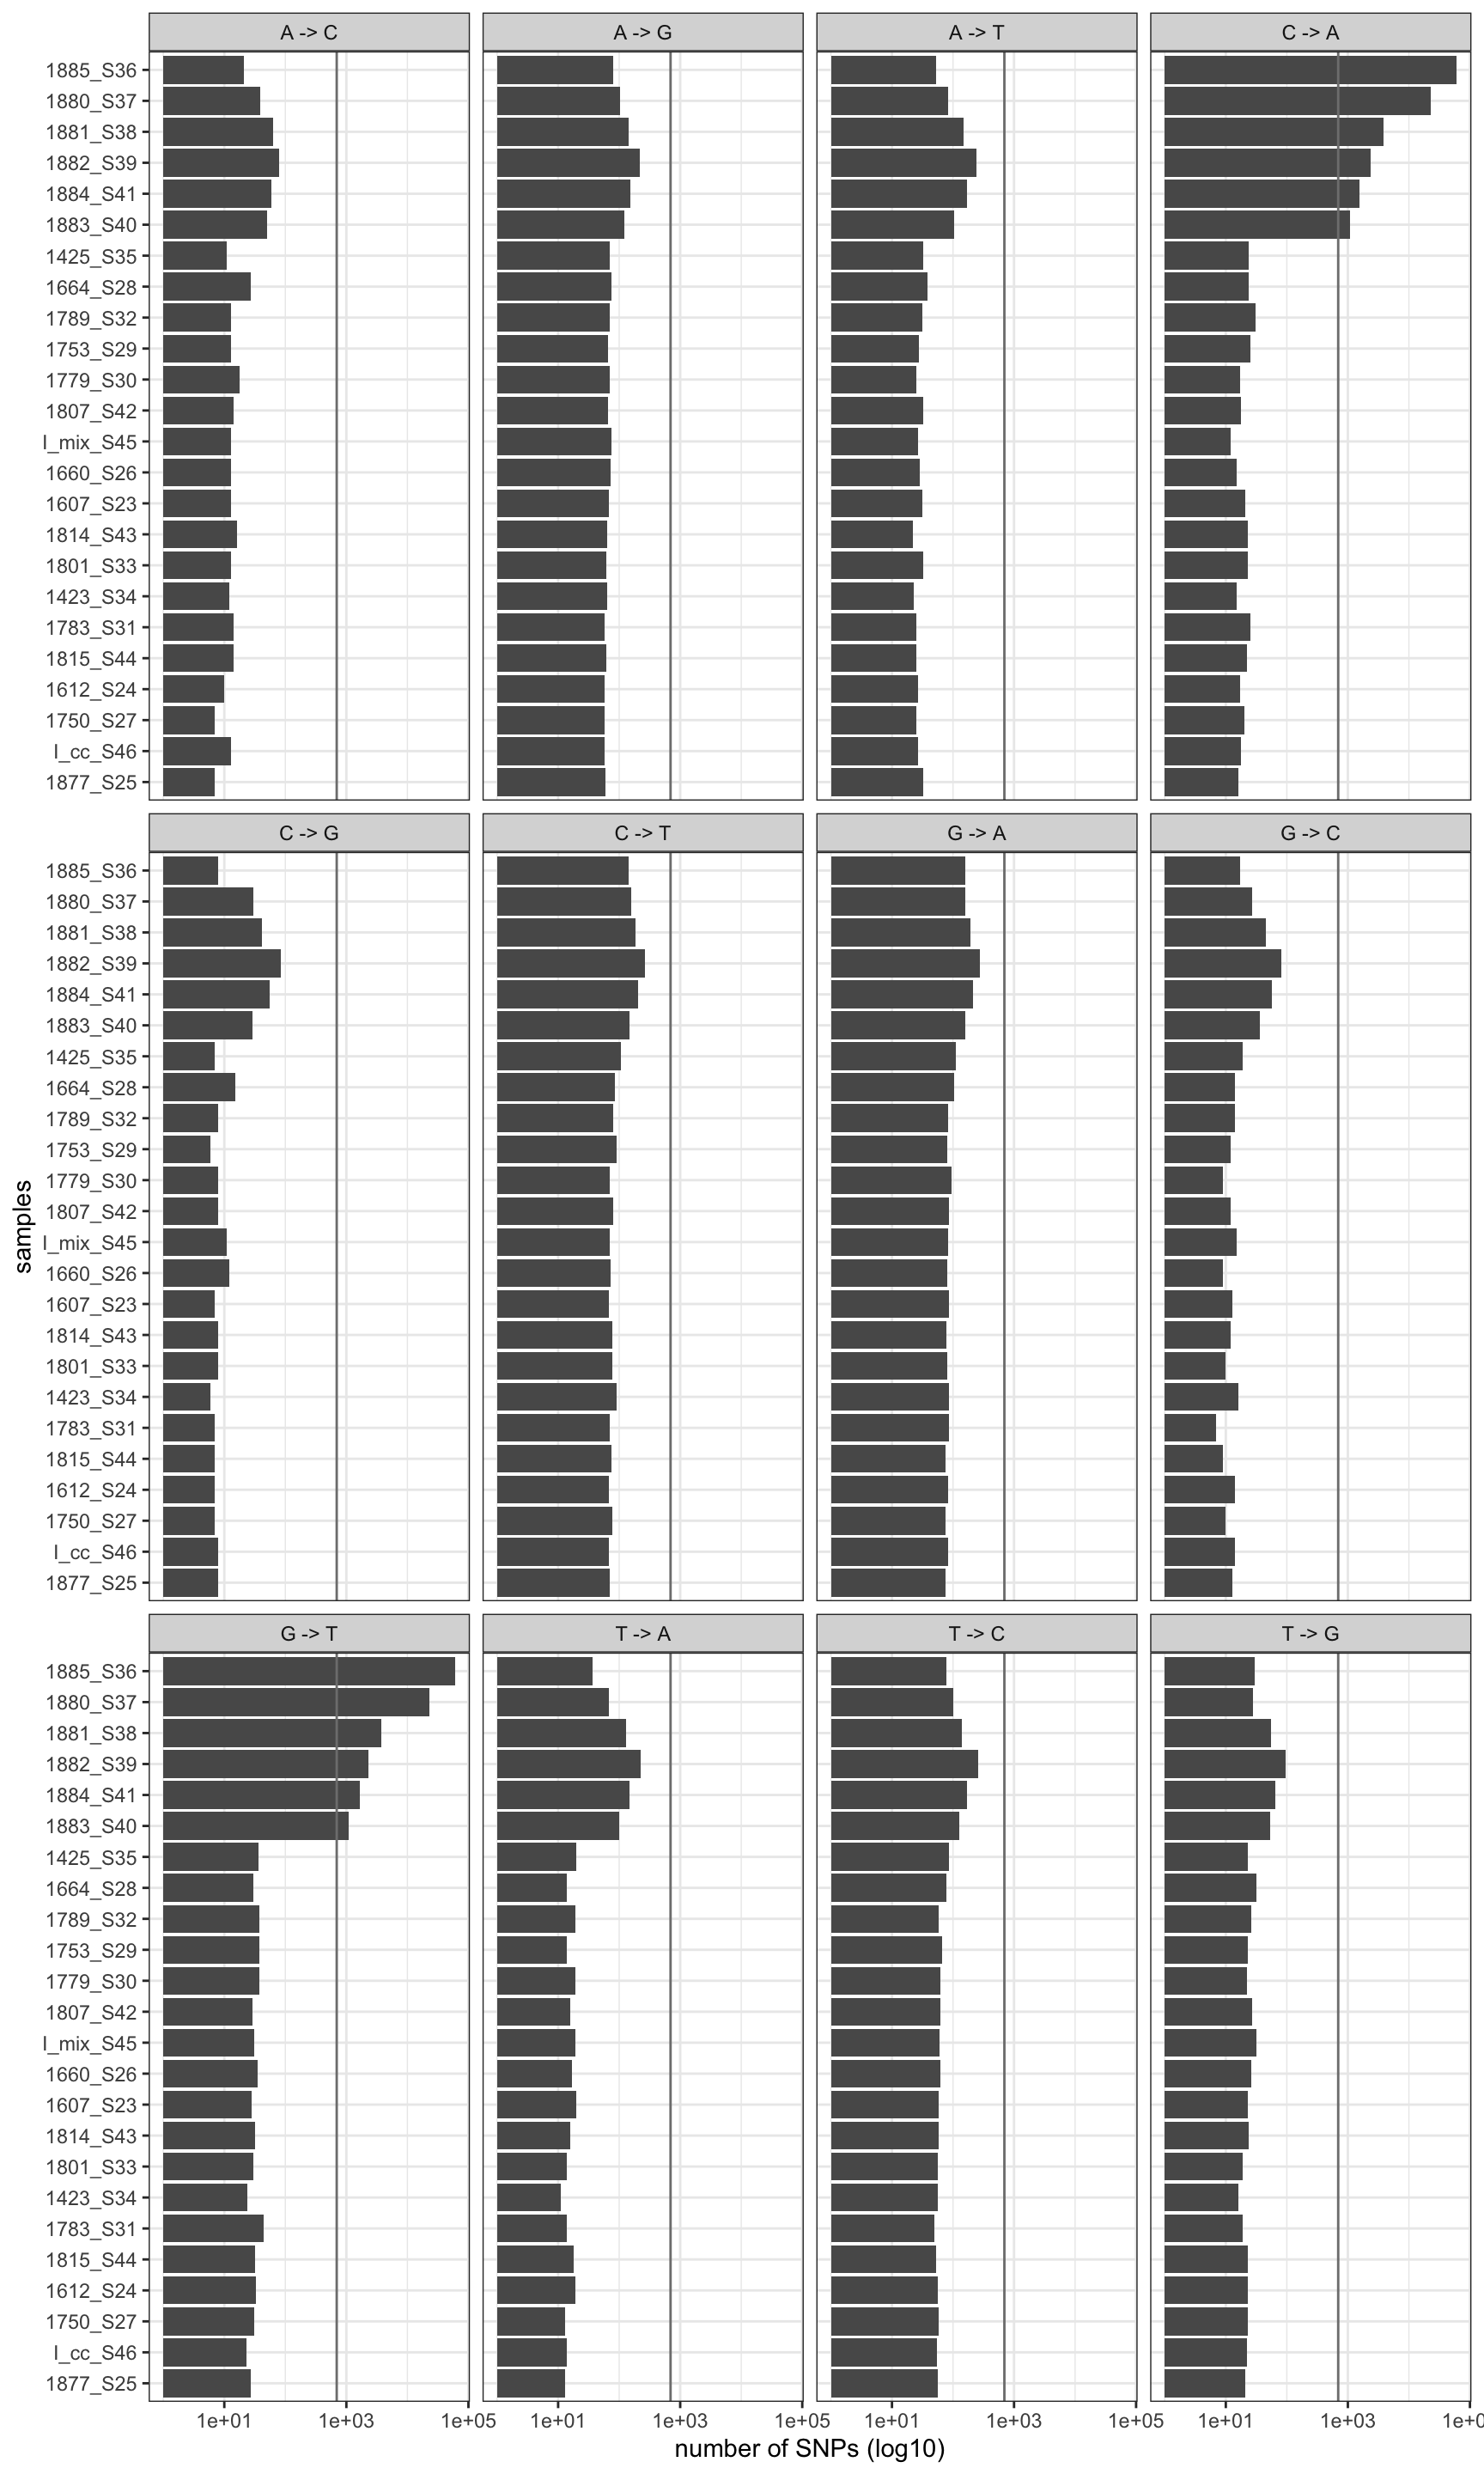
Figure 2.1: Mutation profile before removal. Vertical line is the global mean number of mutation rates
# remove all C>A and G>T on selected samples
affected_samples <- dat.agg[which(dat.agg$dummy > median_threshold), ]$sample
dat <- readRDS("data/rds/omm_claudia_new.rds")
dat_outlier <- which(dat$alteration_type == "SNP" & dat$sample %in% affected_samples & (dat$alteration ==
    "C -> A" | dat$alteration == "G -> T"))
dat_corrected <- dat[-dat_outlier, ]
saveRDS(dat_corrected, file = "data/rds/omm_claudia_new.rds")  # filtered mutation bias
write.table(dat_corrected, file = "results/Claudia_samples_variants_long.tsv", sep = "\t", quote = F,
    row.names = F)
nrow(dat_corrected)  # number of variants in total
## [1] 22707# plot again
dat_corrected2 <- dat_corrected[which(dat_corrected$alteration_type == "SNP"), ]
dat_corrected2$dummy <- 1
# summarize by alteration type
dat_corrected2.agg <- aggregate(dummy ~ alteration + sample, dat_corrected2, sum)
p <- ggplot(dat_corrected2.agg, aes(x = reorder(sample, dummy), y = dummy, group = alteration)) +
ylab("number of SNPs (log10)") + xlab("samples")
p <- p + geom_bar(stat = "identity") + coord_flip() + facet_wrap(~alteration) + scale_y_log10()
p <- p + theme_bw() + geom_hline(yintercept = median_threshold, colour = "grey50")
print(p)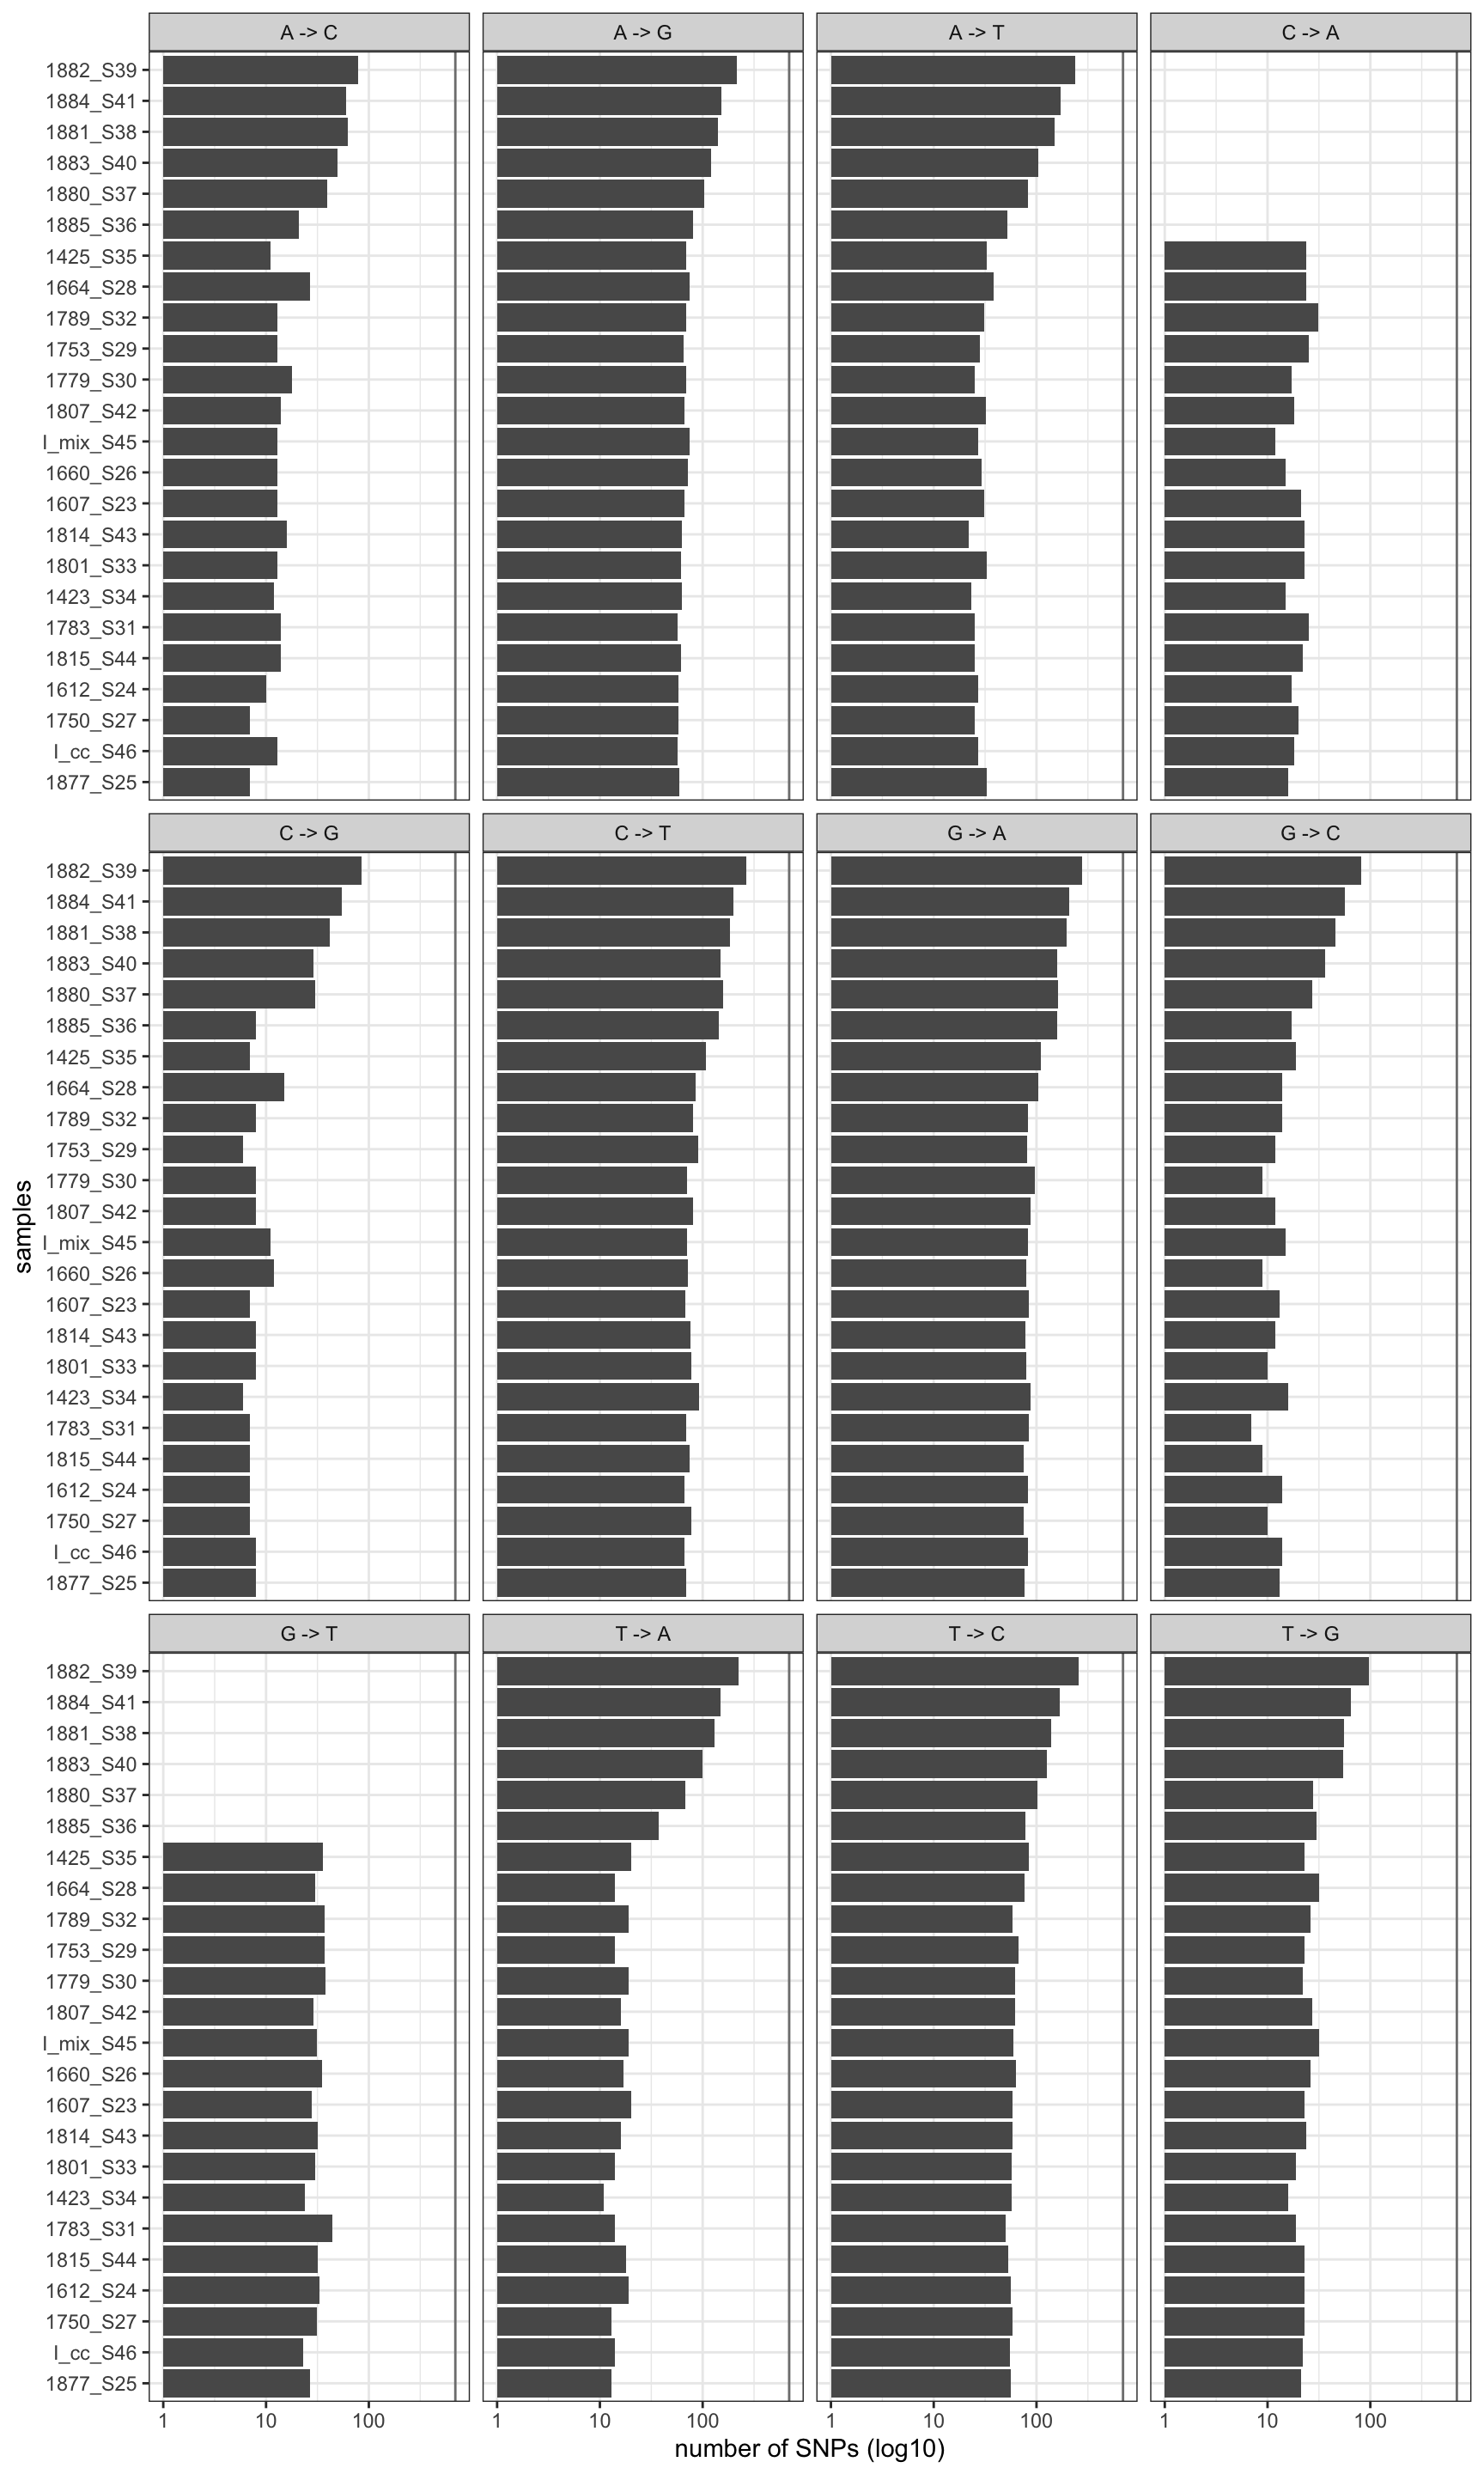
Figure 2.2: Mutation profile after removal. Vertical line is the global mean number of mutation rates befor filtering
2.6 AF frequency
dat <- readRDS("data/rds/omm_claudia_new.rds")
library(scales)

p <- ggplot(dat, aes(AF, fill = mouse.group)) + geom_histogram()
p <- p + facet_wrap(~genome + genome_hr, scales = "free", ncol = 3)
p <- p + xlab("AF") + ylab("occurence") + theme_minimal()
plotly::ggplotly(p)
## `stat_bin()` using `bins = 30`. Pick better value with `binwidth`.Figure 2.3: AF of resequenced strains
dat <- readRDS("data/rds/omm_claudia_new.rds")
p <- ggplot(dat, aes(majorAF, fill = mouse.group)) + geom_histogram()
p <- p + theme_minimal()
p <- p + facet_wrap(~genome + genome_hr, scales = "free", ncol = 3)
p <- p + xlab("AF") + ylab("occurence")
plotly::ggplotly(p)
## `stat_bin()` using `bins = 30`. Pick better value with `binwidth`.Figure 2.4: major AF of resequenced strains
2.7 number of variants per group
dat <- readRDS("data/rds/omm_claudia_new.rds")
dat$variants <- 1
dat.agg <- aggregate(variants ~ mouse.id + alteration_type + genome_hr, dat, sum)
DT::datatable(dat.agg)
2.7.1 number of variants per treatment group
2.7.2 deletion
dat <- readRDS("data/rds/omm_claudia_new.rds")
dat$variants <- 1
dat.agg <- aggregate(variants ~ mouse.id + mouse.group + alteration_type + genome_hr, dat, sum)
p <- ggplot(dat.agg, aes(x = reorder(mouse.id, -variants), y = variants, color = alteration_type,
    group = alteration_type, shape = factor(alteration_type)))
p <- p + geom_jitter(size = 0.4) + facet_grid(genome_hr ~ mouse.group, space = "free", scales = "free_x")
p <- p + geom_line() + scale_y_log10()
p <- p + theme_minimal() + ylab("number variants")
p <- p + theme(axis.text.x = element_text(angle = 90, vjust = 0.5, hjust = 1))
p
## geom_path: Each group consists of only one observation. Do you need to adjust the group
## aesthetic?
## geom_path: Each group consists of only one observation. Do you need to adjust the group
## aesthetic?
## geom_path: Each group consists of only one observation. Do you need to adjust the group
## aesthetic?
## geom_path: Each group consists of only one observation. Do you need to adjust the group
## aesthetic?
## geom_path: Each group consists of only one observation. Do you need to adjust the group
## aesthetic?
## geom_path: Each group consists of only one observation. Do you need to adjust the group
## aesthetic?
## geom_path: Each group consists of only one observation. Do you need to adjust the group
## aesthetic?
## geom_path: Each group consists of only one observation. Do you need to adjust the group
## aesthetic?
## geom_path: Each group consists of only one observation. Do you need to adjust the group
## aesthetic?
## geom_path: Each group consists of only one observation. Do you need to adjust the group
## aesthetic?
## geom_path: Each group consists of only one observation. Do you need to adjust the group
## aesthetic?
## geom_path: Each group consists of only one observation. Do you need to adjust the group
## aesthetic?
## geom_path: Each group consists of only one observation. Do you need to adjust the group
## aesthetic?
## geom_path: Each group consists of only one observation. Do you need to adjust the group
## aesthetic?
## geom_path: Each group consists of only one observation. Do you need to adjust the group
## aesthetic?
## geom_path: Each group consists of only one observation. Do you need to adjust the group
## aesthetic?
## geom_path: Each group consists of only one observation. Do you need to adjust the group
## aesthetic?
## geom_path: Each group consists of only one observation. Do you need to adjust the group
## aesthetic?
## geom_path: Each group consists of only one observation. Do you need to adjust the group
## aesthetic?
## geom_path: Each group consists of only one observation. Do you need to adjust the group
## aesthetic?
## geom_path: Each group consists of only one observation. Do you need to adjust the group
## aesthetic?
## geom_path: Each group consists of only one observation. Do you need to adjust the group
## aesthetic?
## geom_path: Each group consists of only one observation. Do you need to adjust the group
## aesthetic?
## geom_path: Each group consists of only one observation. Do you need to adjust the group
## aesthetic?
## geom_path: Each group consists of only one observation. Do you need to adjust the group
## aesthetic?
## geom_path: Each group consists of only one observation. Do you need to adjust the group
## aesthetic?
## geom_path: Each group consists of only one observation. Do you need to adjust the group
## aesthetic?
## geom_path: Each group consists of only one observation. Do you need to adjust the group
## aesthetic?
## geom_path: Each group consists of only one observation. Do you need to adjust the group
## aesthetic?
## geom_path: Each group consists of only one observation. Do you need to adjust the group
## aesthetic?
## geom_path: Each group consists of only one observation. Do you need to adjust the group
## aesthetic?
## geom_path: Each group consists of only one observation. Do you need to adjust the group
## aesthetic?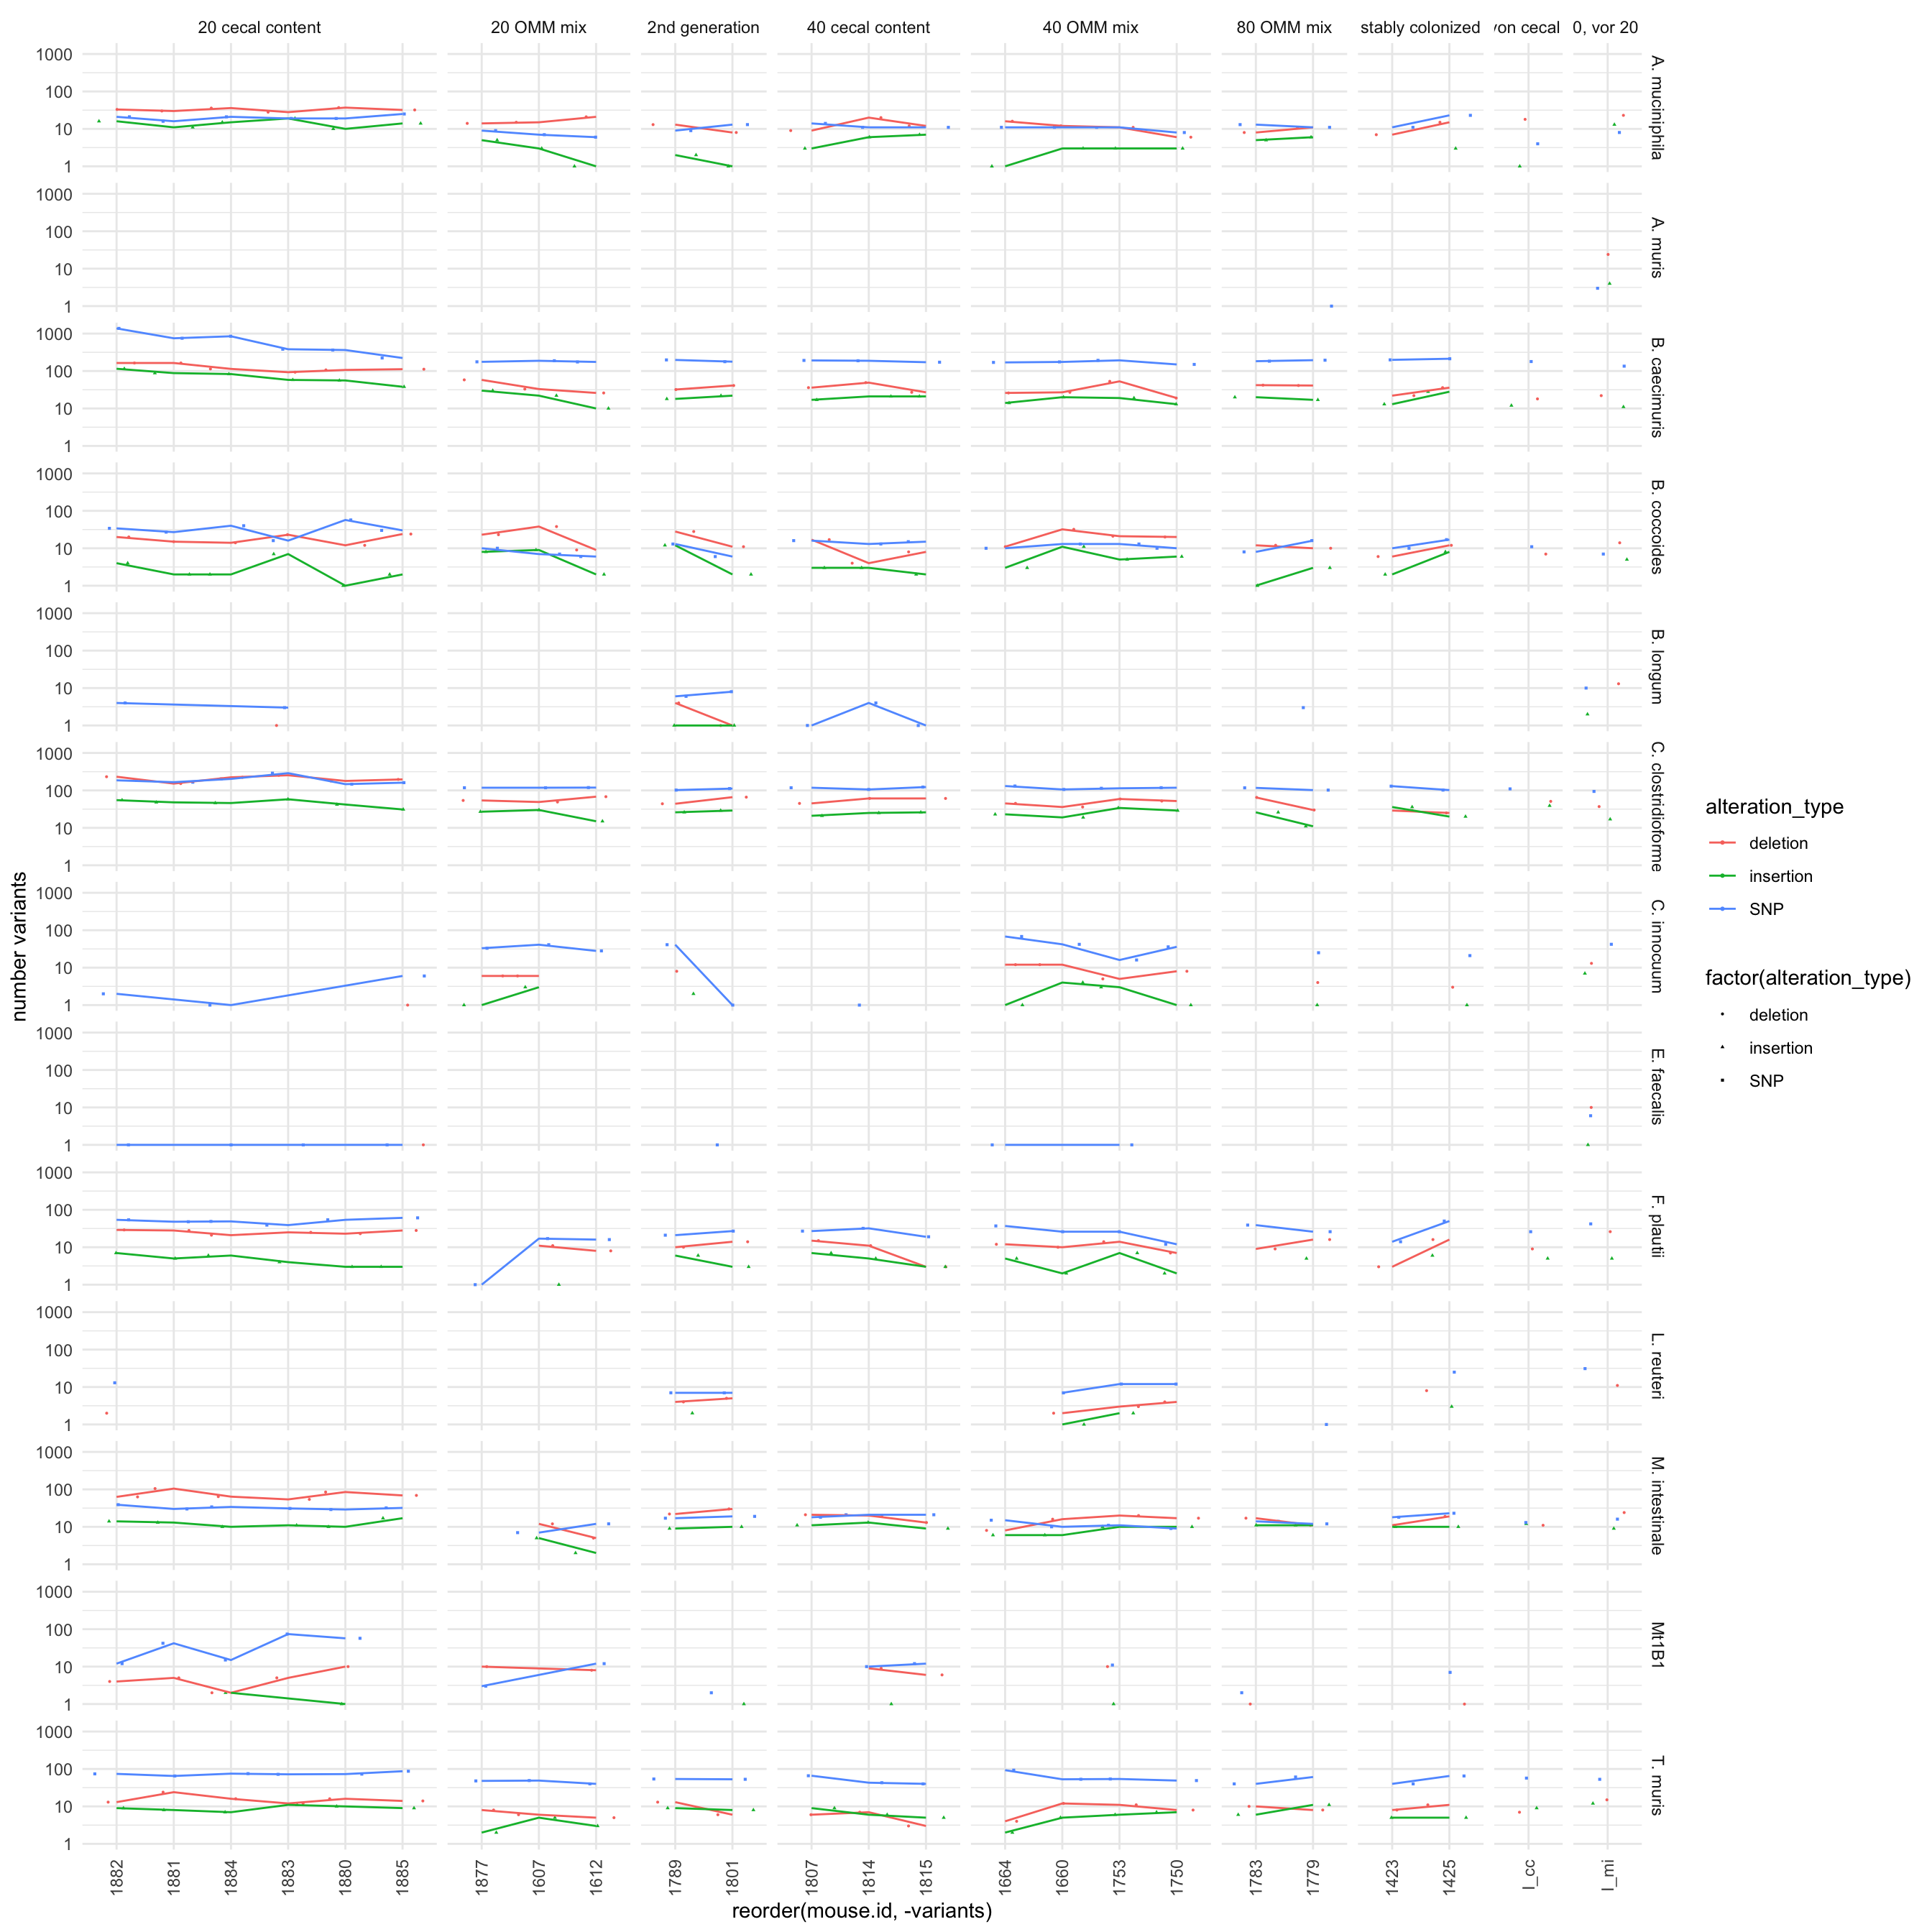
Figure 2.5: total number of variants of all 12 OMM genomes by mouse and grouyp stratified by variant type. Seems there is still a outlier (20 cecal content caecimuris, where some samples have more than 1000 varaints)
2.8 Filter out low AF variants
dat <- readRDS("data/rds/omm_claudia_new.rds")
dat_filtered <- dat[which(dat$AF >= 0.25), ]
saveRDS(dat_filtered, file = "data/rds/omm_claudia_new_10percent.rds")
Every analysis and plot which comes below is now filtered and includes only variants with a AF >=25%
2.9 Heatmap
library(circlize)
library(ComplexHeatmap)

dat <- readRDS("data/rds/omm_claudia_new_10percent.rds")
dat$variant.id <- paste0(dat$POS, "-", dat$REF, "-", dat$ALT)
data.wide <- dcast(dat, variant.id ~ sample, value.var = "AF")
## Warning in dcast(dat, variant.id ~ sample, value.var = "AF"): The dcast generic
## in data.table has been passed a data.frame and will attempt to redirect to the
## reshape2::dcast; please note that reshape2 is deprecated, and this redirection is now
## deprecated as well. Please do this redirection yourself like reshape2::dcast(dat). In the
## next version, this warning will become an error.data.wide[is.na(data.wide)] <- 0
rownames(data.wide) <- data.wide$variant.id
data.wide$variant.id <- NULL
heat <- data.matrix(data.wide)
heat2 <- heat
# limit to variants that are present in at least 10% of samples heat_num <- rowSums(heat !=
# 0) heat2 <- heat[which(heat_num > ncol(heat)/10),]
dat$dummy <- 1
annot.data <- aggregate(dummy ~ sample + mouse.group + day, dat, sum)
heat3.day <- annot.data[match(colnames(heat2), annot.data$sample), ]$day
heat3.mouse.group <- as.character(as.matrix(annot.data[match(colnames(heat2), annot.data$sample),
]$mouse.group))
genome <- dat[match(rownames(heat2), dat$variant.id), ]$genome
ha2 = rowAnnotation(genome = genome)
# data.wide.sub <- dat[match(colnames(heat3), dat$sample.id),]
col_fun = colorRamp2(c(0, 0.5, 1), c("white", "yellow", "red"))
ha = HeatmapAnnotation(group = heat3.mouse.group, col = list(group = c(`stably colonized` = "red",
`20 OMM mix` = "lightgreen", `40 OMM mix` = "green", `80 OMM mix` = "darkgreen", `2nd generation` = "purple",
`40 cecal content` = "brown", `20 cecal content` = "yellow", `Tag 0, von cecal content` = "blue",
`Tag 0, vor 20 tage` = "red")))
Heatmap(heat2, name = "AF", top_annotation = ha, border = TRUE, col = col_fun, right_annotation = ha2,
cluster_columns = T, row_gap = unit(0, "mm"), column_gap = unit(0, "mm"), column_names_gp = gpar(fontsize = 5),
row_names_gp = gpar(fontsize = 3), show_row_dend = F, show_row_names = F, show_column_dend = T)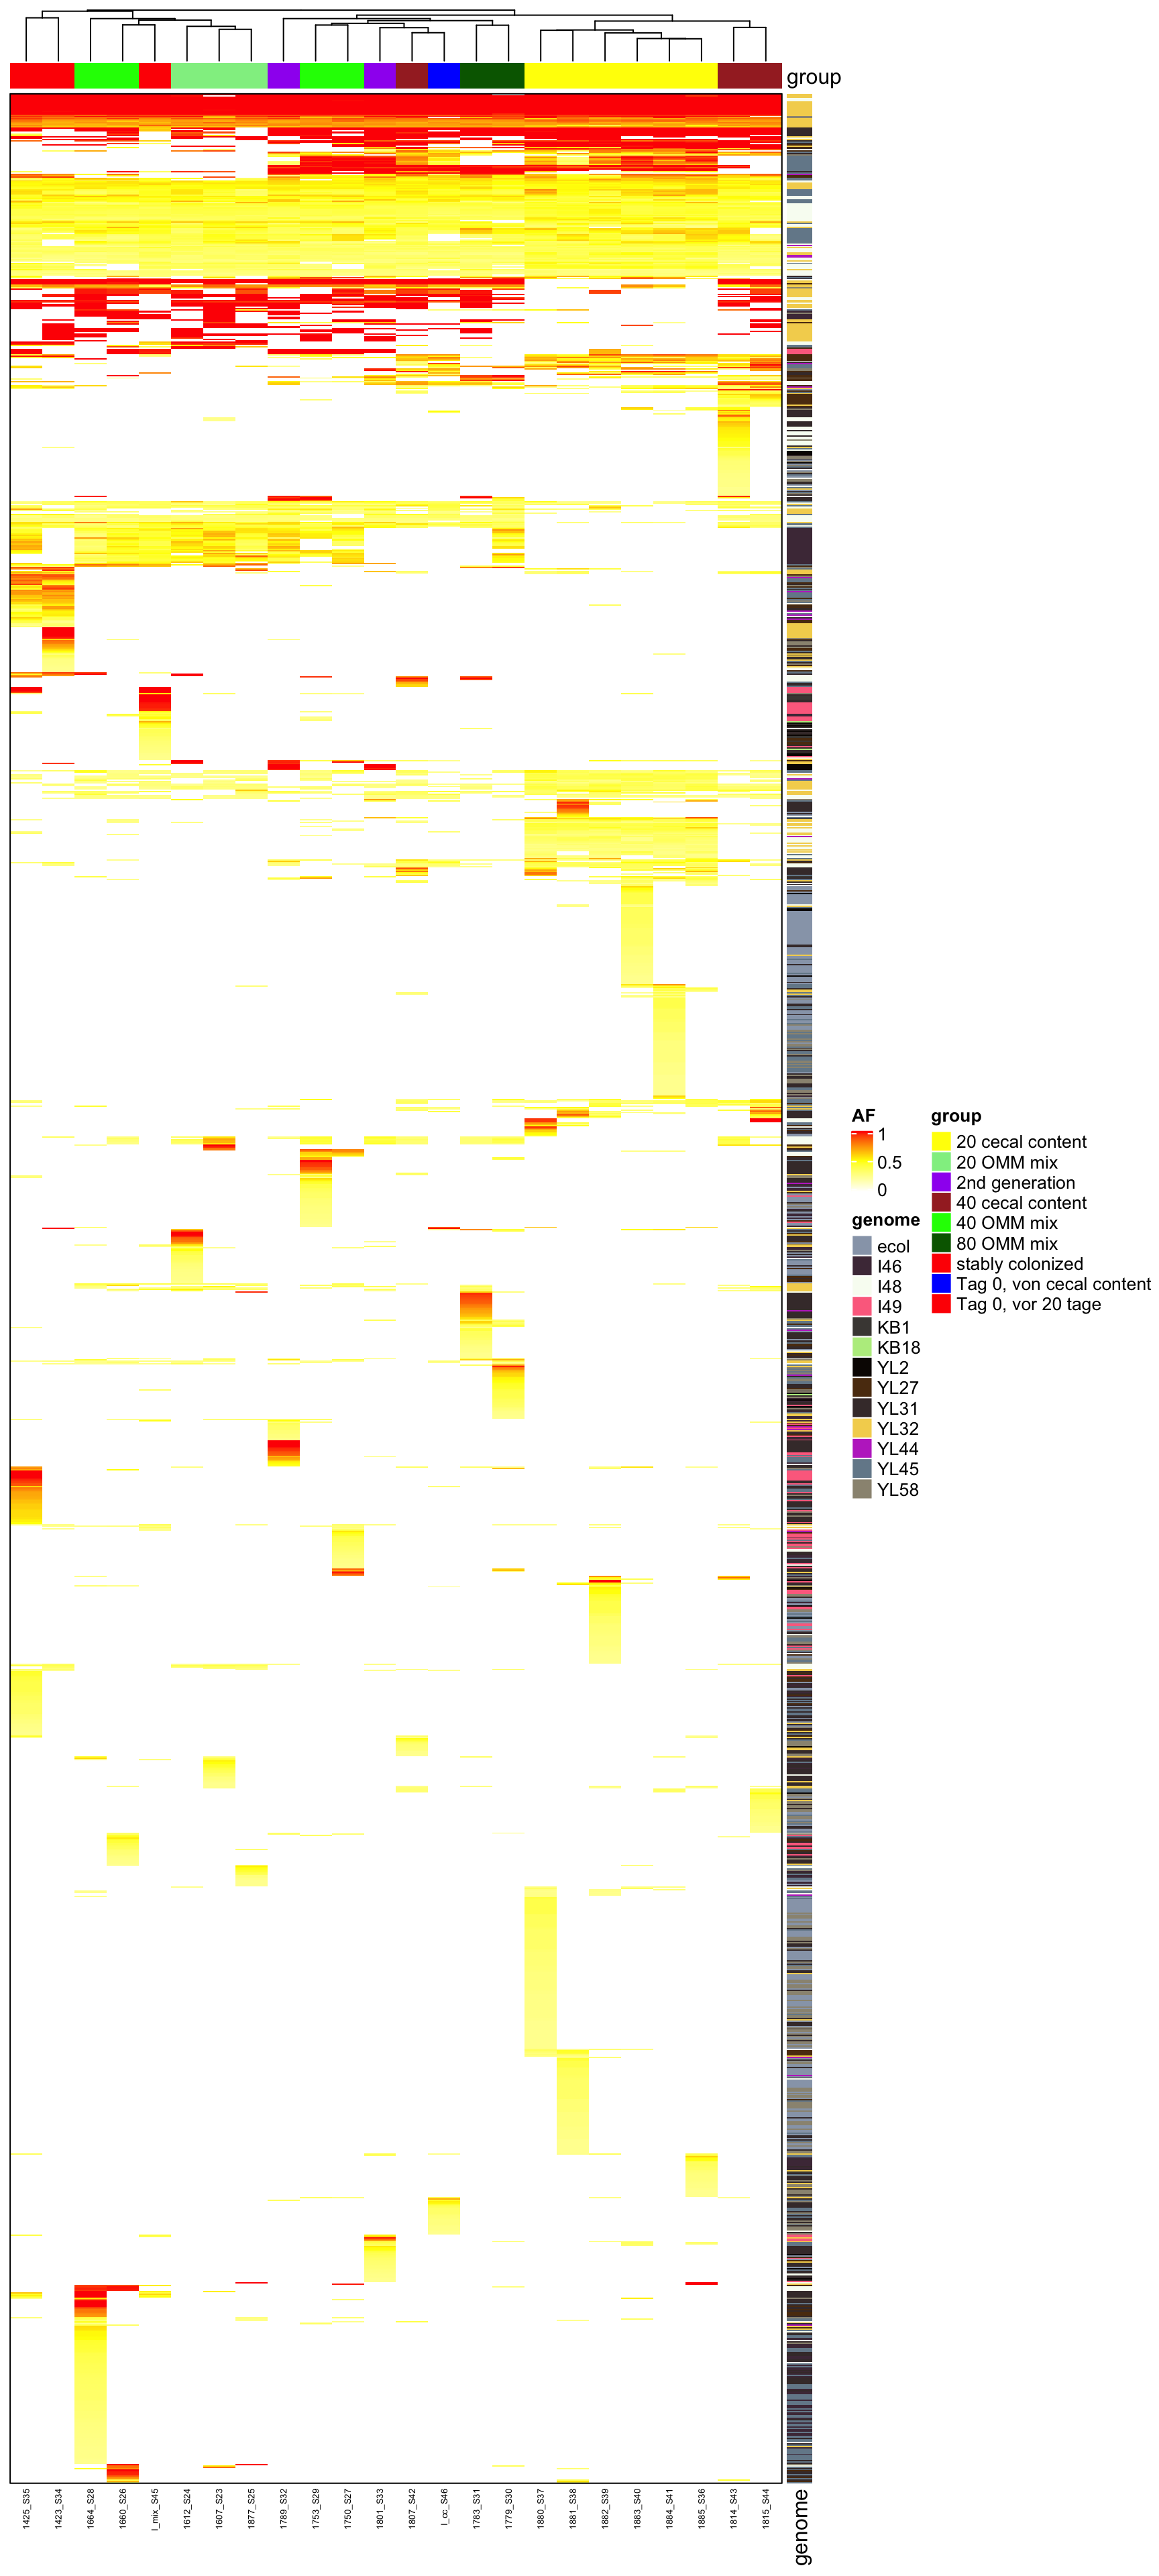
Figure 2.6: AF of all variants (after mutation bias filtering)
2.10 one genome
library(circlize)
library(ComplexHeatmap)

dat <- readRDS("data/rds/omm_claudia_new_10percent.rds")
dat <- dat[dat$genome_hr == "B. coccoides", ]
dat$variant.id <- paste0(dat$POS, "-", dat$REF, "-", dat$ALT)
data.wide <- dcast(dat, variant.id ~ sample, value.var = "AF")
## Warning in dcast(dat, variant.id ~ sample, value.var = "AF"): The dcast generic
## in data.table has been passed a data.frame and will attempt to redirect to the
## reshape2::dcast; please note that reshape2 is deprecated, and this redirection is now
## deprecated as well. Please do this redirection yourself like reshape2::dcast(dat). In the
## next version, this warning will become an error.data.wide[is.na(data.wide)] <- 0
rownames(data.wide) <- data.wide$variant.id
data.wide$variant.id <- NULL
heat <- data.matrix(data.wide)
heat2 <- heat
# limit to variants that are present in at least 10% of samples heat_num <- rowSums(heat !=
# 0) heat2 <- heat[which(heat_num > ncol(heat)/10),]
dat$dummy <- 1
annot.data <- aggregate(dummy ~ sample + mouse.group + day, dat, sum)
heat3.day <- annot.data[match(colnames(heat2), annot.data$sample), ]$day
heat3.mouse.group <- as.character(as.matrix(annot.data[match(colnames(heat2), annot.data$sample),
]$mouse.group))
genome <- dat[match(rownames(heat2), dat$variant.id), ]$genome
ha2 = rowAnnotation(genome = genome)
# data.wide.sub <- dat[match(colnames(heat3), dat$sample.id),]
col_fun = colorRamp2(c(0, 0.5, 1), c("white", "yellow", "red"))
ha = HeatmapAnnotation(group = heat3.mouse.group, col = list(group = c(`stably colonized` = "red",
`20 OMM mix` = "lightgreen", `40 OMM mix` = "green", `80 OMM mix` = "darkgreen", `2nd generation` = "purple",
`40 cecal content` = "brown", `20 cecal content` = "yellow", `Tag 0, von cecal content` = "blue",
`Tag 0, vor 20 tage` = "red")))
Heatmap(heat2, name = "AF", top_annotation = ha, border = TRUE, col = col_fun, right_annotation = ha2,
cluster_columns = T, row_gap = unit(0, "mm"), column_gap = unit(0, "mm"), column_names_gp = gpar(fontsize = 5),
row_names_gp = gpar(fontsize = 3), show_row_dend = F, show_row_names = F, show_column_dend = T)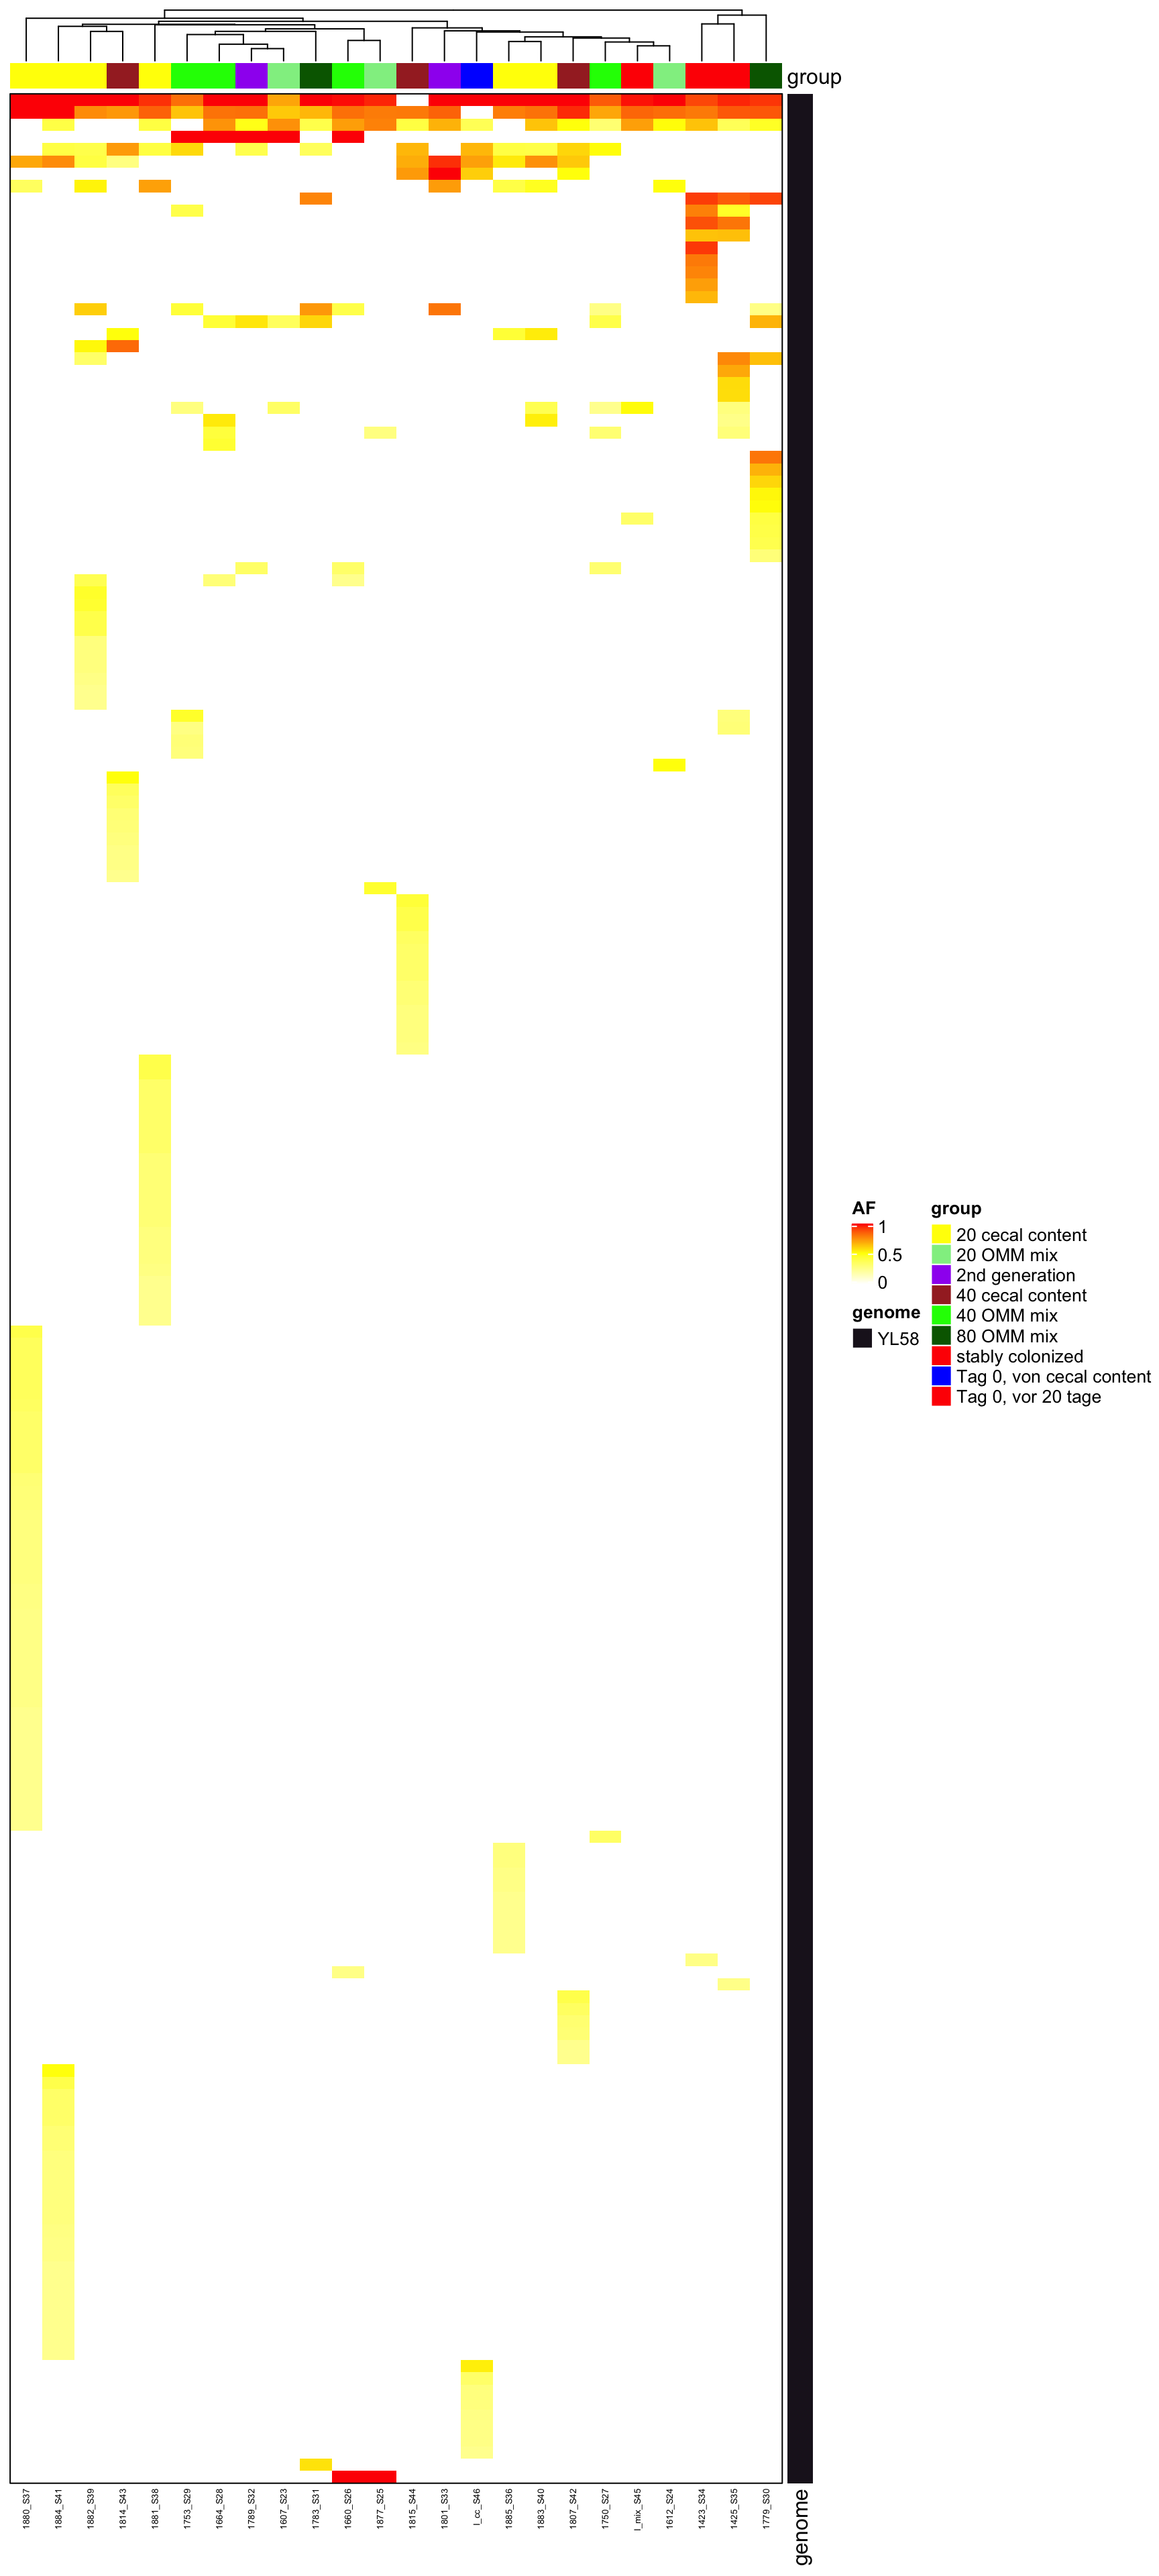
Figure 2.7: AF of all variants (after mutation bias filtering)
Variants that are non-zero in every sample (e.g. observed as a variant)
dat <- readRDS("data/rds/omm_claudia_new_10percent.rds")
dat$variant.id <- paste0(dat$POS, "-", dat$REF, "-", dat$ALT)
data.wide <- dcast(dat, variant.id ~ sample, value.var = "AF")
## Warning in dcast(dat, variant.id ~ sample, value.var = "AF"): The dcast generic
## in data.table has been passed a data.frame and will attempt to redirect to the
## reshape2::dcast; please note that reshape2 is deprecated, and this redirection is now
## deprecated as well. Please do this redirection yourself like reshape2::dcast(dat). In the
## next version, this warning will become an error.data.wide[is.na(data.wide)] <- 0
rownames(data.wide) <- data.wide$variant.id
data.wide$variant.id <- NULL
nrow(data.wide)## [1] 1854write.table(data.wide, file = "results/Claudia_samples_variants_wide.tsv", sep = "\t", row.names = T,
quote = F)
heat <- data.wide
# limit to variants that are present in all samples
heat_num <- rowSums(heat != 0)
heat2 <- heat[which(heat_num == ncol(heat)), ]
heat2 <- data.matrix(heat2)
# annotation
dat$dummy <- 1
annot.data <- aggregate(dummy ~ sample + mouse.group + day, dat, sum)
heat3.day <- annot.data[match(colnames(heat2), annot.data$sample), ]$day
heat3.mouse.group <- as.character(as.matrix(annot.data[match(colnames(heat2), annot.data$sample),
]$mouse.group))
ha = HeatmapAnnotation(group = heat3.mouse.group, col = list(group = c(`stably colonized` = "red",
`20 OMM mix` = "lightgreen", `40 OMM mix` = "green", `80 OMM mix` = "darkgreen", `2nd generation` = "purple",
`40 cecal content` = "brown", `20 cecal content` = "yellow", `Tag 0, von cecal content` = "blue",
`Tag 0, vor 20 tage` = "red")))
genome <- dat[match(rownames(heat2), dat$variant.id), ]$genome
feature <- dat[match(rownames(heat2), dat$variant.id), ]$feature
ha2 = rowAnnotation(genome = genome, labels = feature)
Heatmap(heat2, name = "AF", top_annotation = ha, right_annotation = ha2, border = TRUE, col = col_fun,
cluster_columns = T, row_gap = unit(0, "mm"), column_gap = unit(0, "mm"), column_names_gp = gpar(fontsize = 5),
row_names_gp = gpar(fontsize = 3), show_row_dend = F, show_row_names = T, show_column_dend = T)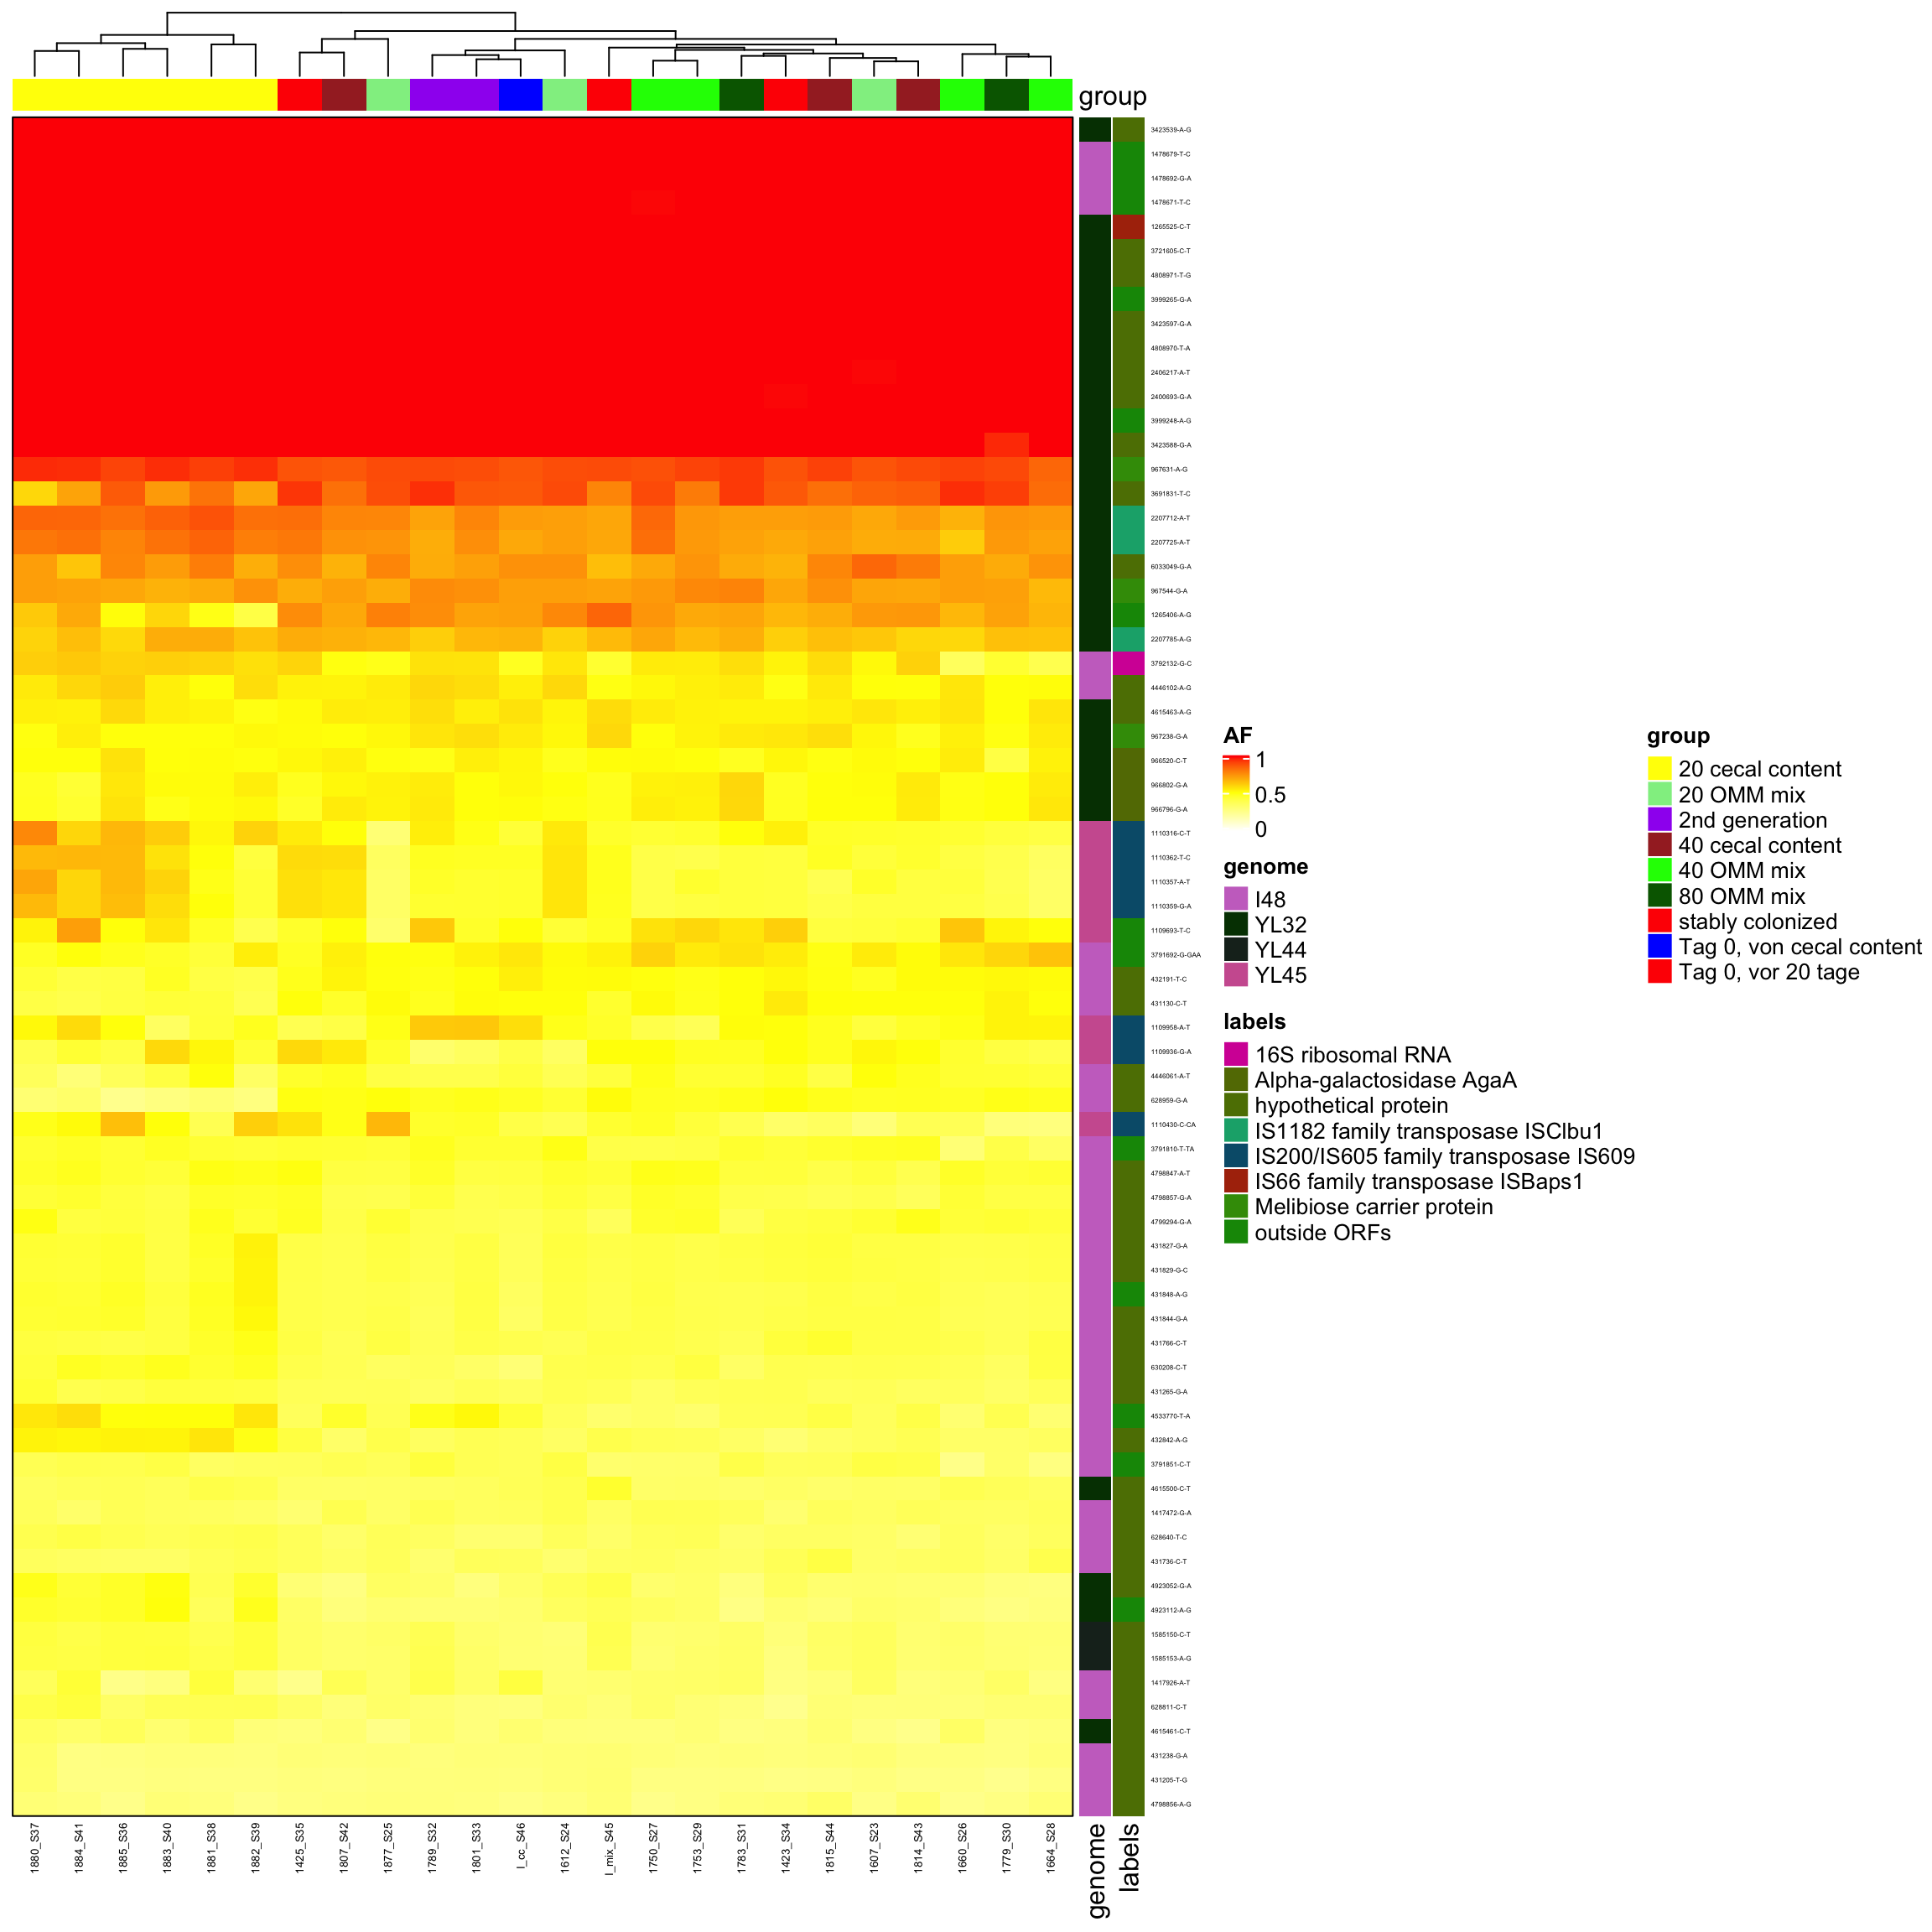
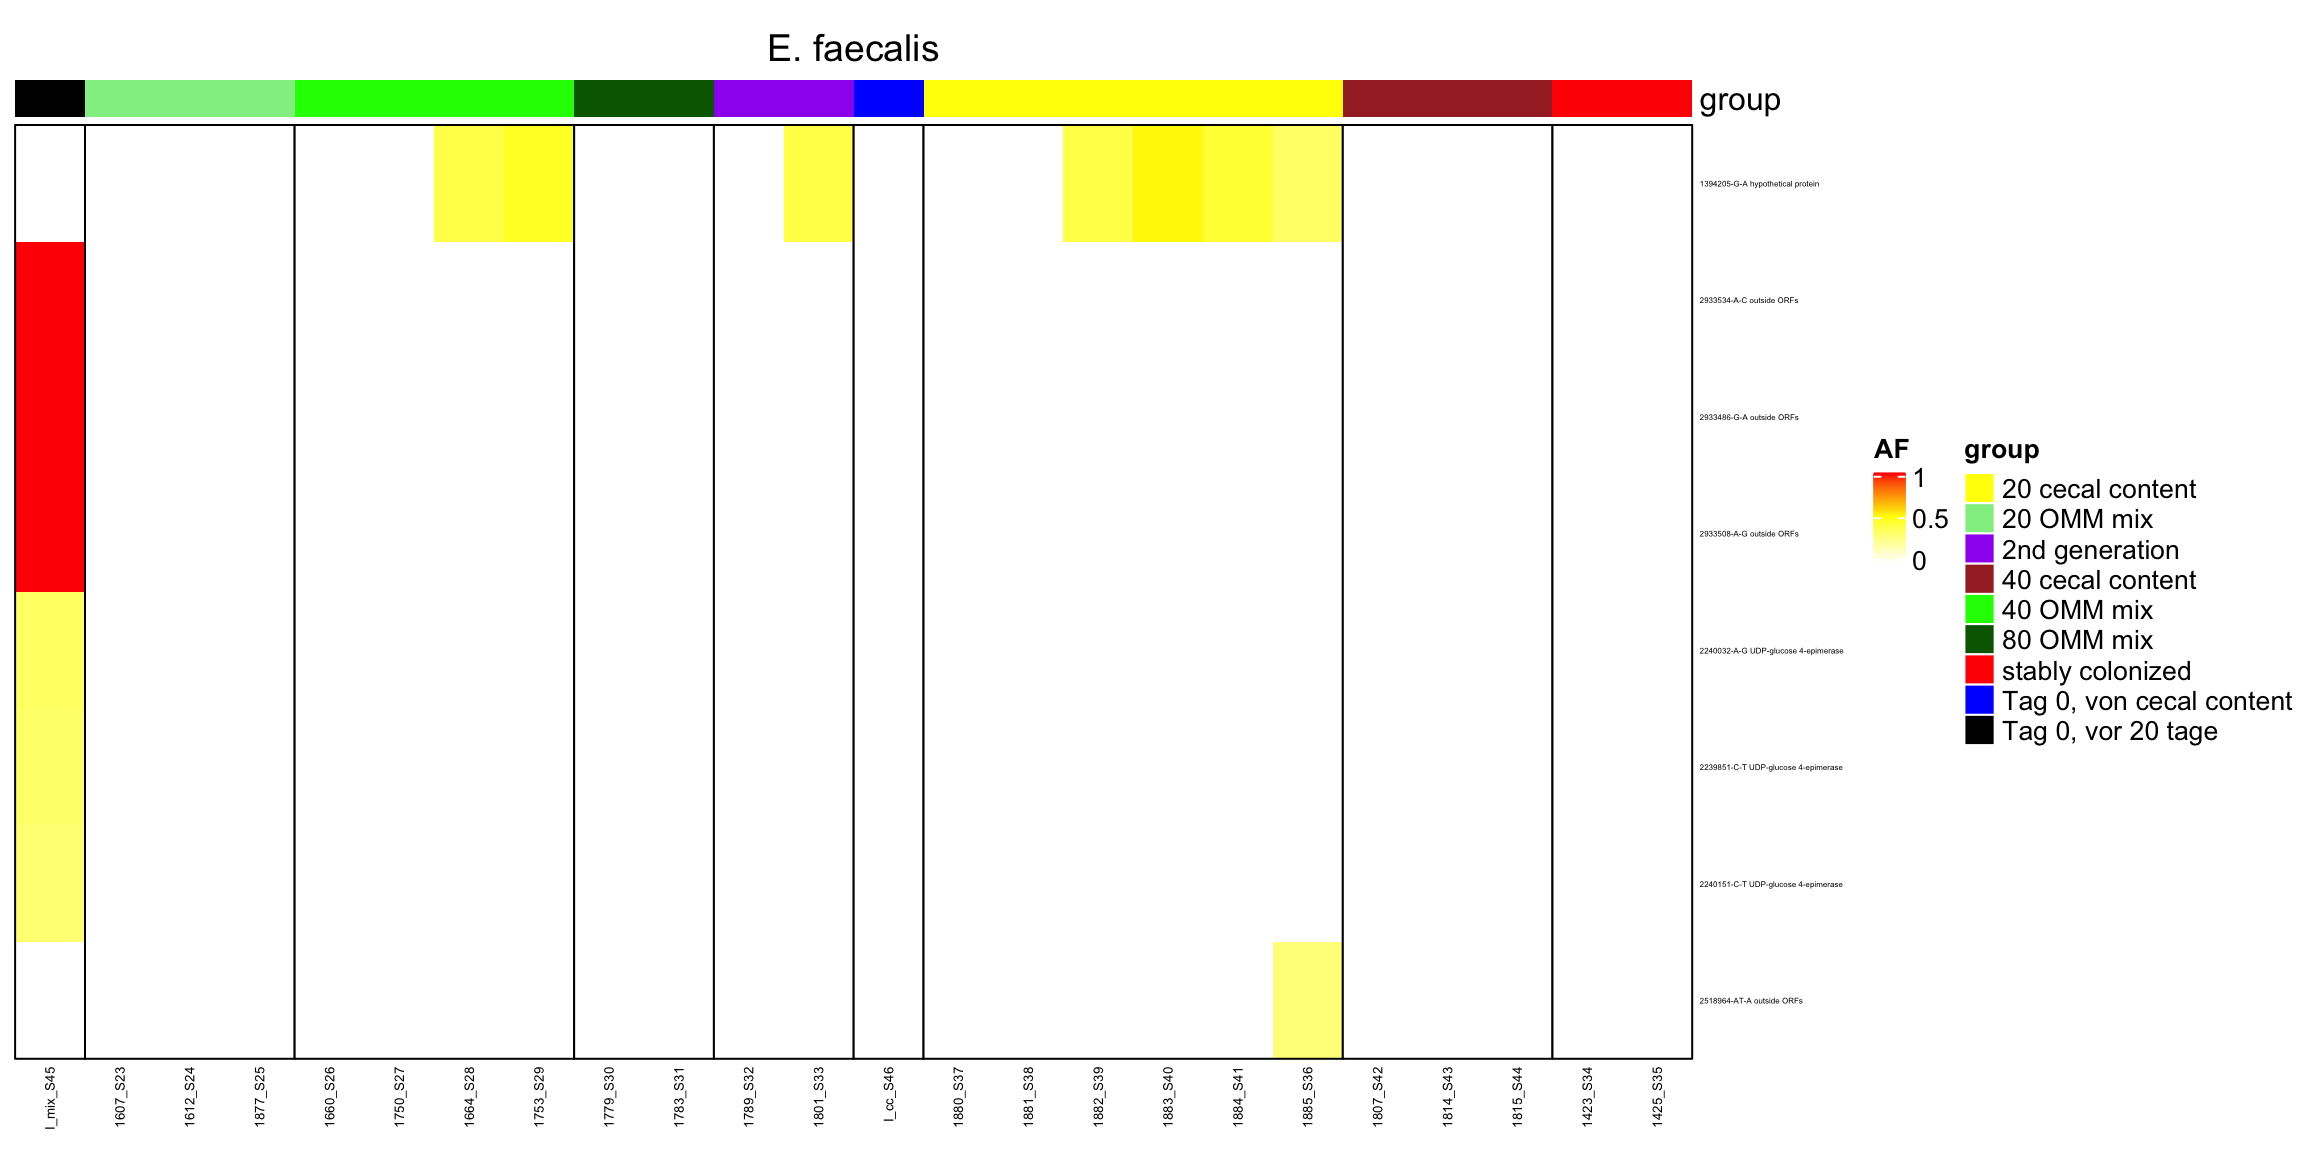
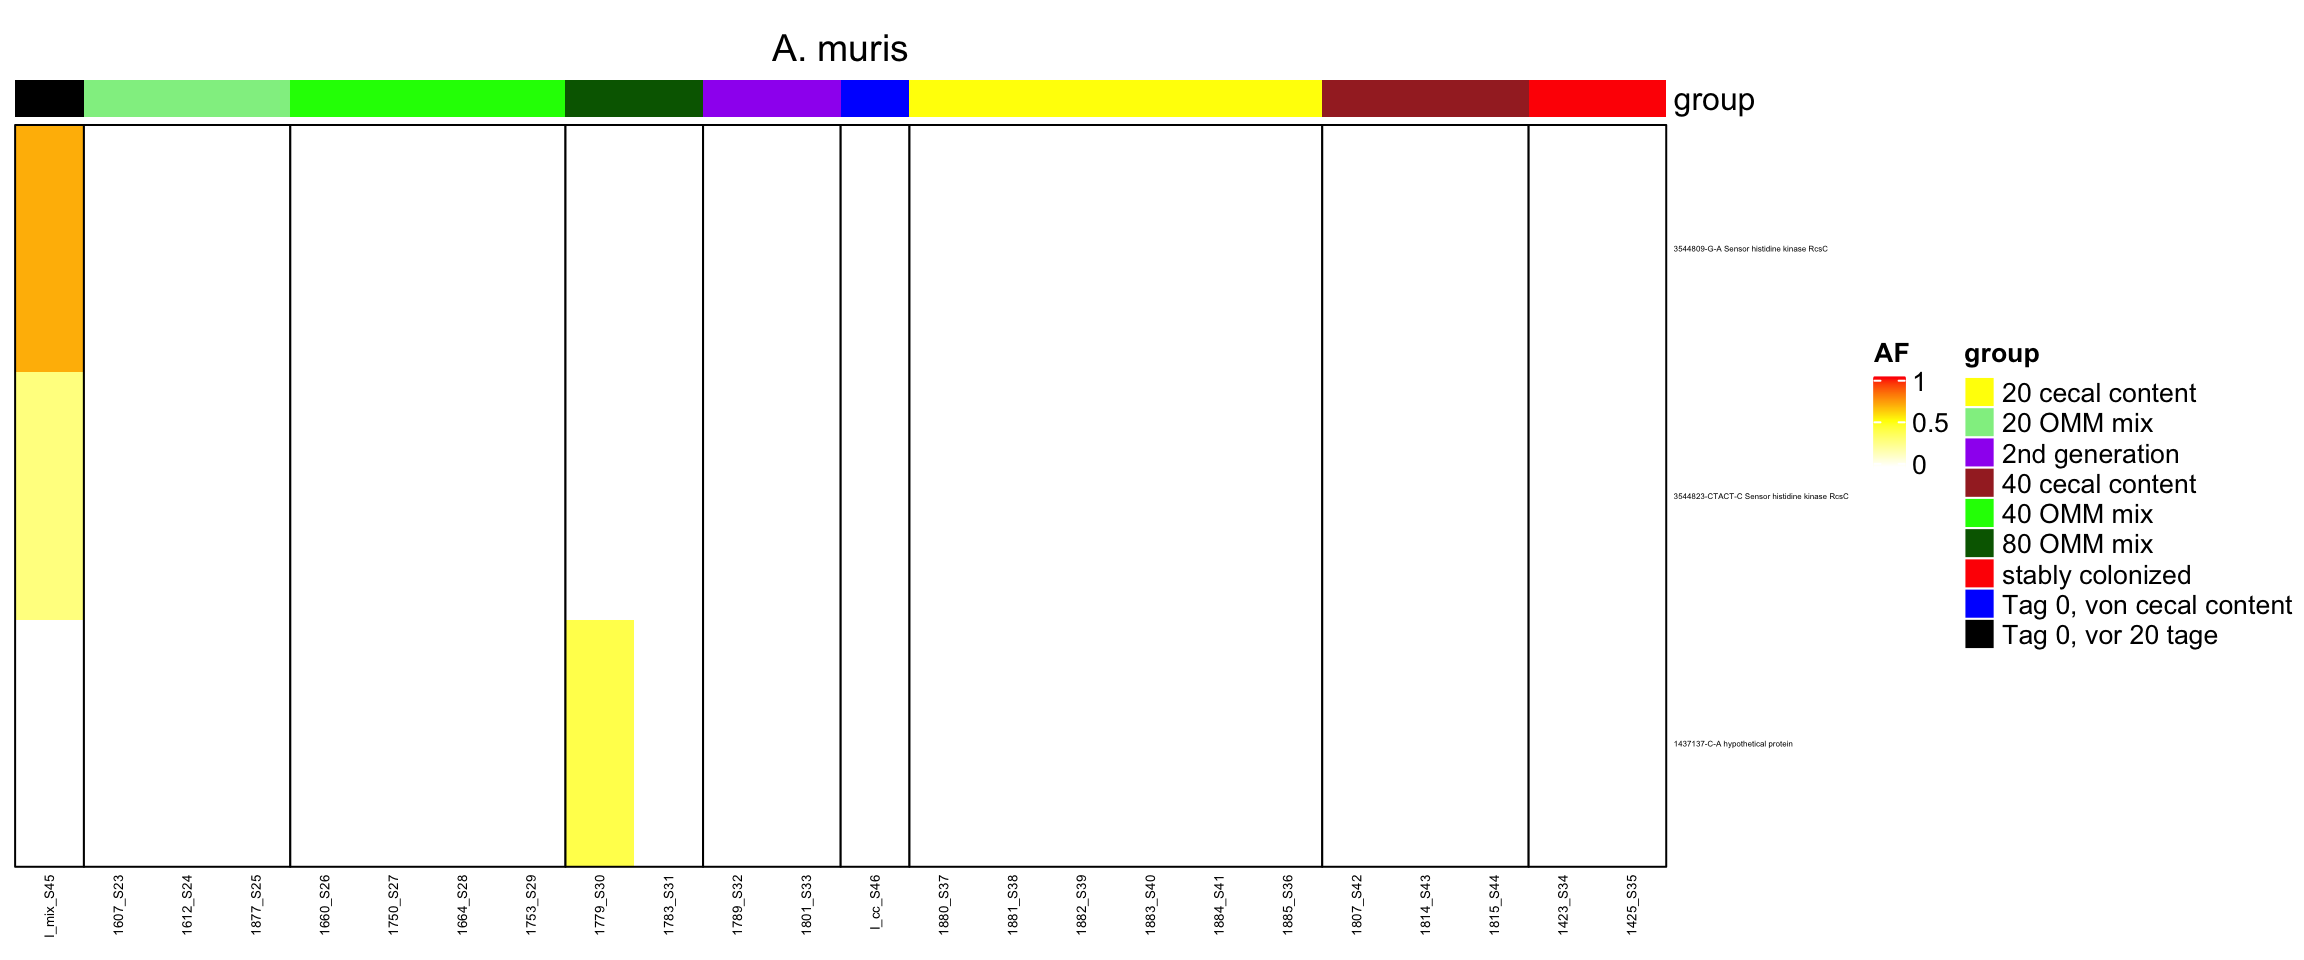
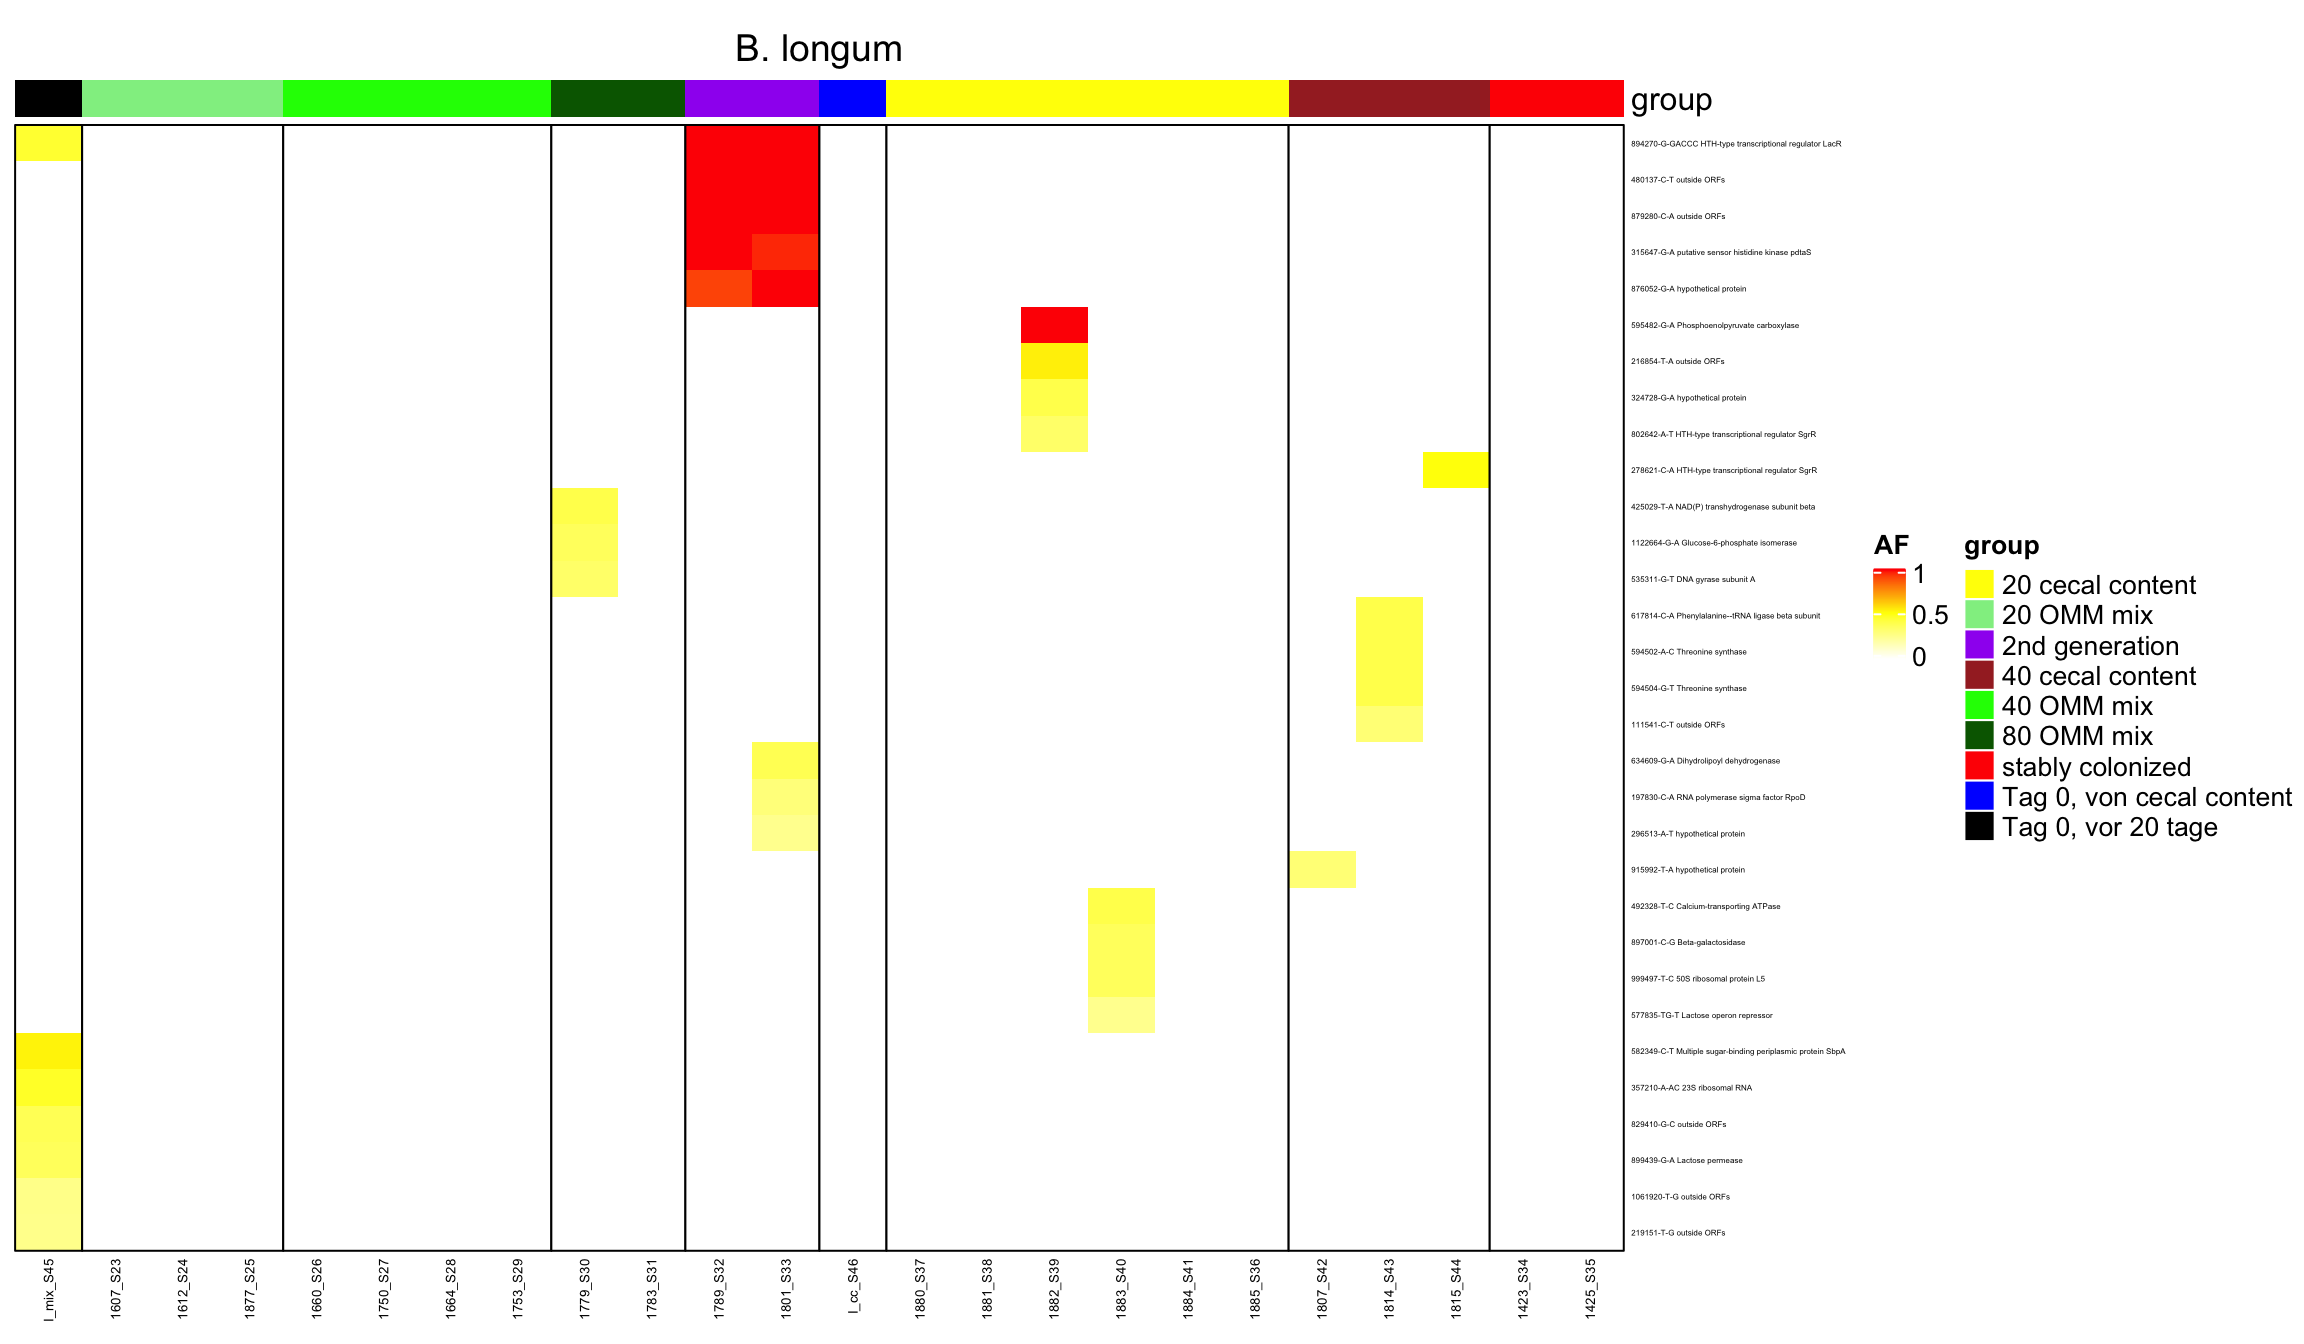
genomeHeat <- function(genome, nohyp = F){
dat <- readRDS("data/rds/omm_claudia_new_10percent.rds")
dat$dummy <- 1
annot.data <- aggregate(dummy ~ sample + mouse.group + day, dat, sum)
dat$variant.id <- paste0(dat$POS, "-", dat$REF, "-", dat$ALT)
dat <- dat[which(dat$genome_hr == genome),]
if (nohyp){
dat <- dat[which(dat$feature != "hypothetical protein"),]
dat <- dat[which(dat$feature != "outside ORFs"),]
}
`%nin%` = Negate(`%in%`)
data.wide <- reshape2::dcast(dat, variant.id ~ sample, value.var = "AF")
# add missing columns
colorder <- c("I_mix_S45",
"1607_S23", "1612_S24", "1877_S25",
"1660_S26", "1750_S27", "1664_S28" , "1753_S29",
"1779_S30", "1783_S31",
"1789_S32", "1801_S33",
"I_cc_S46",
"1880_S37", "1881_S38", "1882_S39", "1883_S40", "1884_S41", "1885_S36",
"1807_S42", "1814_S43", "1815_S44",
"1423_S34", "1425_S35")
namevector <- colorder[colorder %nin% colnames(data.wide)]
data.wide[ , namevector] <- 0
setcolorder(data.wide, colorder)
data.wide[is.na(data.wide)] <- 0
rownames(data.wide) <- data.wide$variant.id
data.wide$variant.id <- NULL
nrow(data.wide)
heat <- data.wide
heat2 <- data.matrix(heat)
# annotation
colorder2 <- c("1-",
"2-", "2-", "2-",
"3-", "3-", "3-" , "3-",
"4-", "4-",
"5-", "5-",
"6-",
"7-", "7-", "7-", "7-", "7-", "7-",
"8-", "8-", "8-",
"9-", "9-")
heat3.day <- annot.data[match(colnames(heat2), annot.data$sample),]$day
heat3.mouse.group <- as.character(as.matrix(annot.data[match(colnames(heat2), annot.data$sample),]$mouse.group))
ha = HeatmapAnnotation(group = heat3.mouse.group,
col = list(group = c("stably colonized" = "red",
"20 OMM mix" = "lightgreen",
"40 OMM mix" = "green",
"80 OMM mix" = "darkgreen",
"2nd generation" = "purple",
"40 cecal content" = "brown",
"20 cecal content" = "yellow",
"Tag 0, von cecal content" = "blue",
"Tag 0, vor 20 tage" = "black")))
feature <- dat[match(rownames(heat2), dat$variant.id), ]$feature
rownames(heat2) <- paste0(rownames(heat2), " ",feature )
# colnames to group mapping
clusters <- annot.data[match(colnames(heat2), annot.data$sample),]$mouse.group
cluster2 <- paste0(colorder2, clusters)
if (nohyp){
ha <- Heatmap(heat2, name = "AF", top_annotation =ha,
#right_annotation = ha2,
column_title = genome,
border = TRUE, col = col_fun,
cluster_columns = F,
row_gap = unit(0, "mm"),
column_split = cluster2,
cluster_column_slices = F,
column_gap = unit(0, "mm"),
column_names_gp = gpar(fontsize =5),
row_names_gp = gpar(fontsize = 5),
show_row_dend = F,
show_row_names = T,
show_column_dend = T
)
} else {
ha <- Heatmap(heat2, name = "AF", top_annotation =ha,
#right_annotation = ha2,
column_title = genome,
border = TRUE, col = col_fun,
cluster_columns = F,
row_gap = unit(0, "mm"),
column_split = cluster2,
cluster_column_slices = F,
column_gap = unit(0, "mm"),
column_names_gp = gpar(fontsize =5),
row_names_gp = gpar(fontsize = 3),
show_row_dend = F,
show_row_names = T,
show_column_dend = T
)
}
return(ha)
}
2.10.14 create it as pdf
pdf("heatmaps_no_hyp.pdf", width = 10, height = 20)
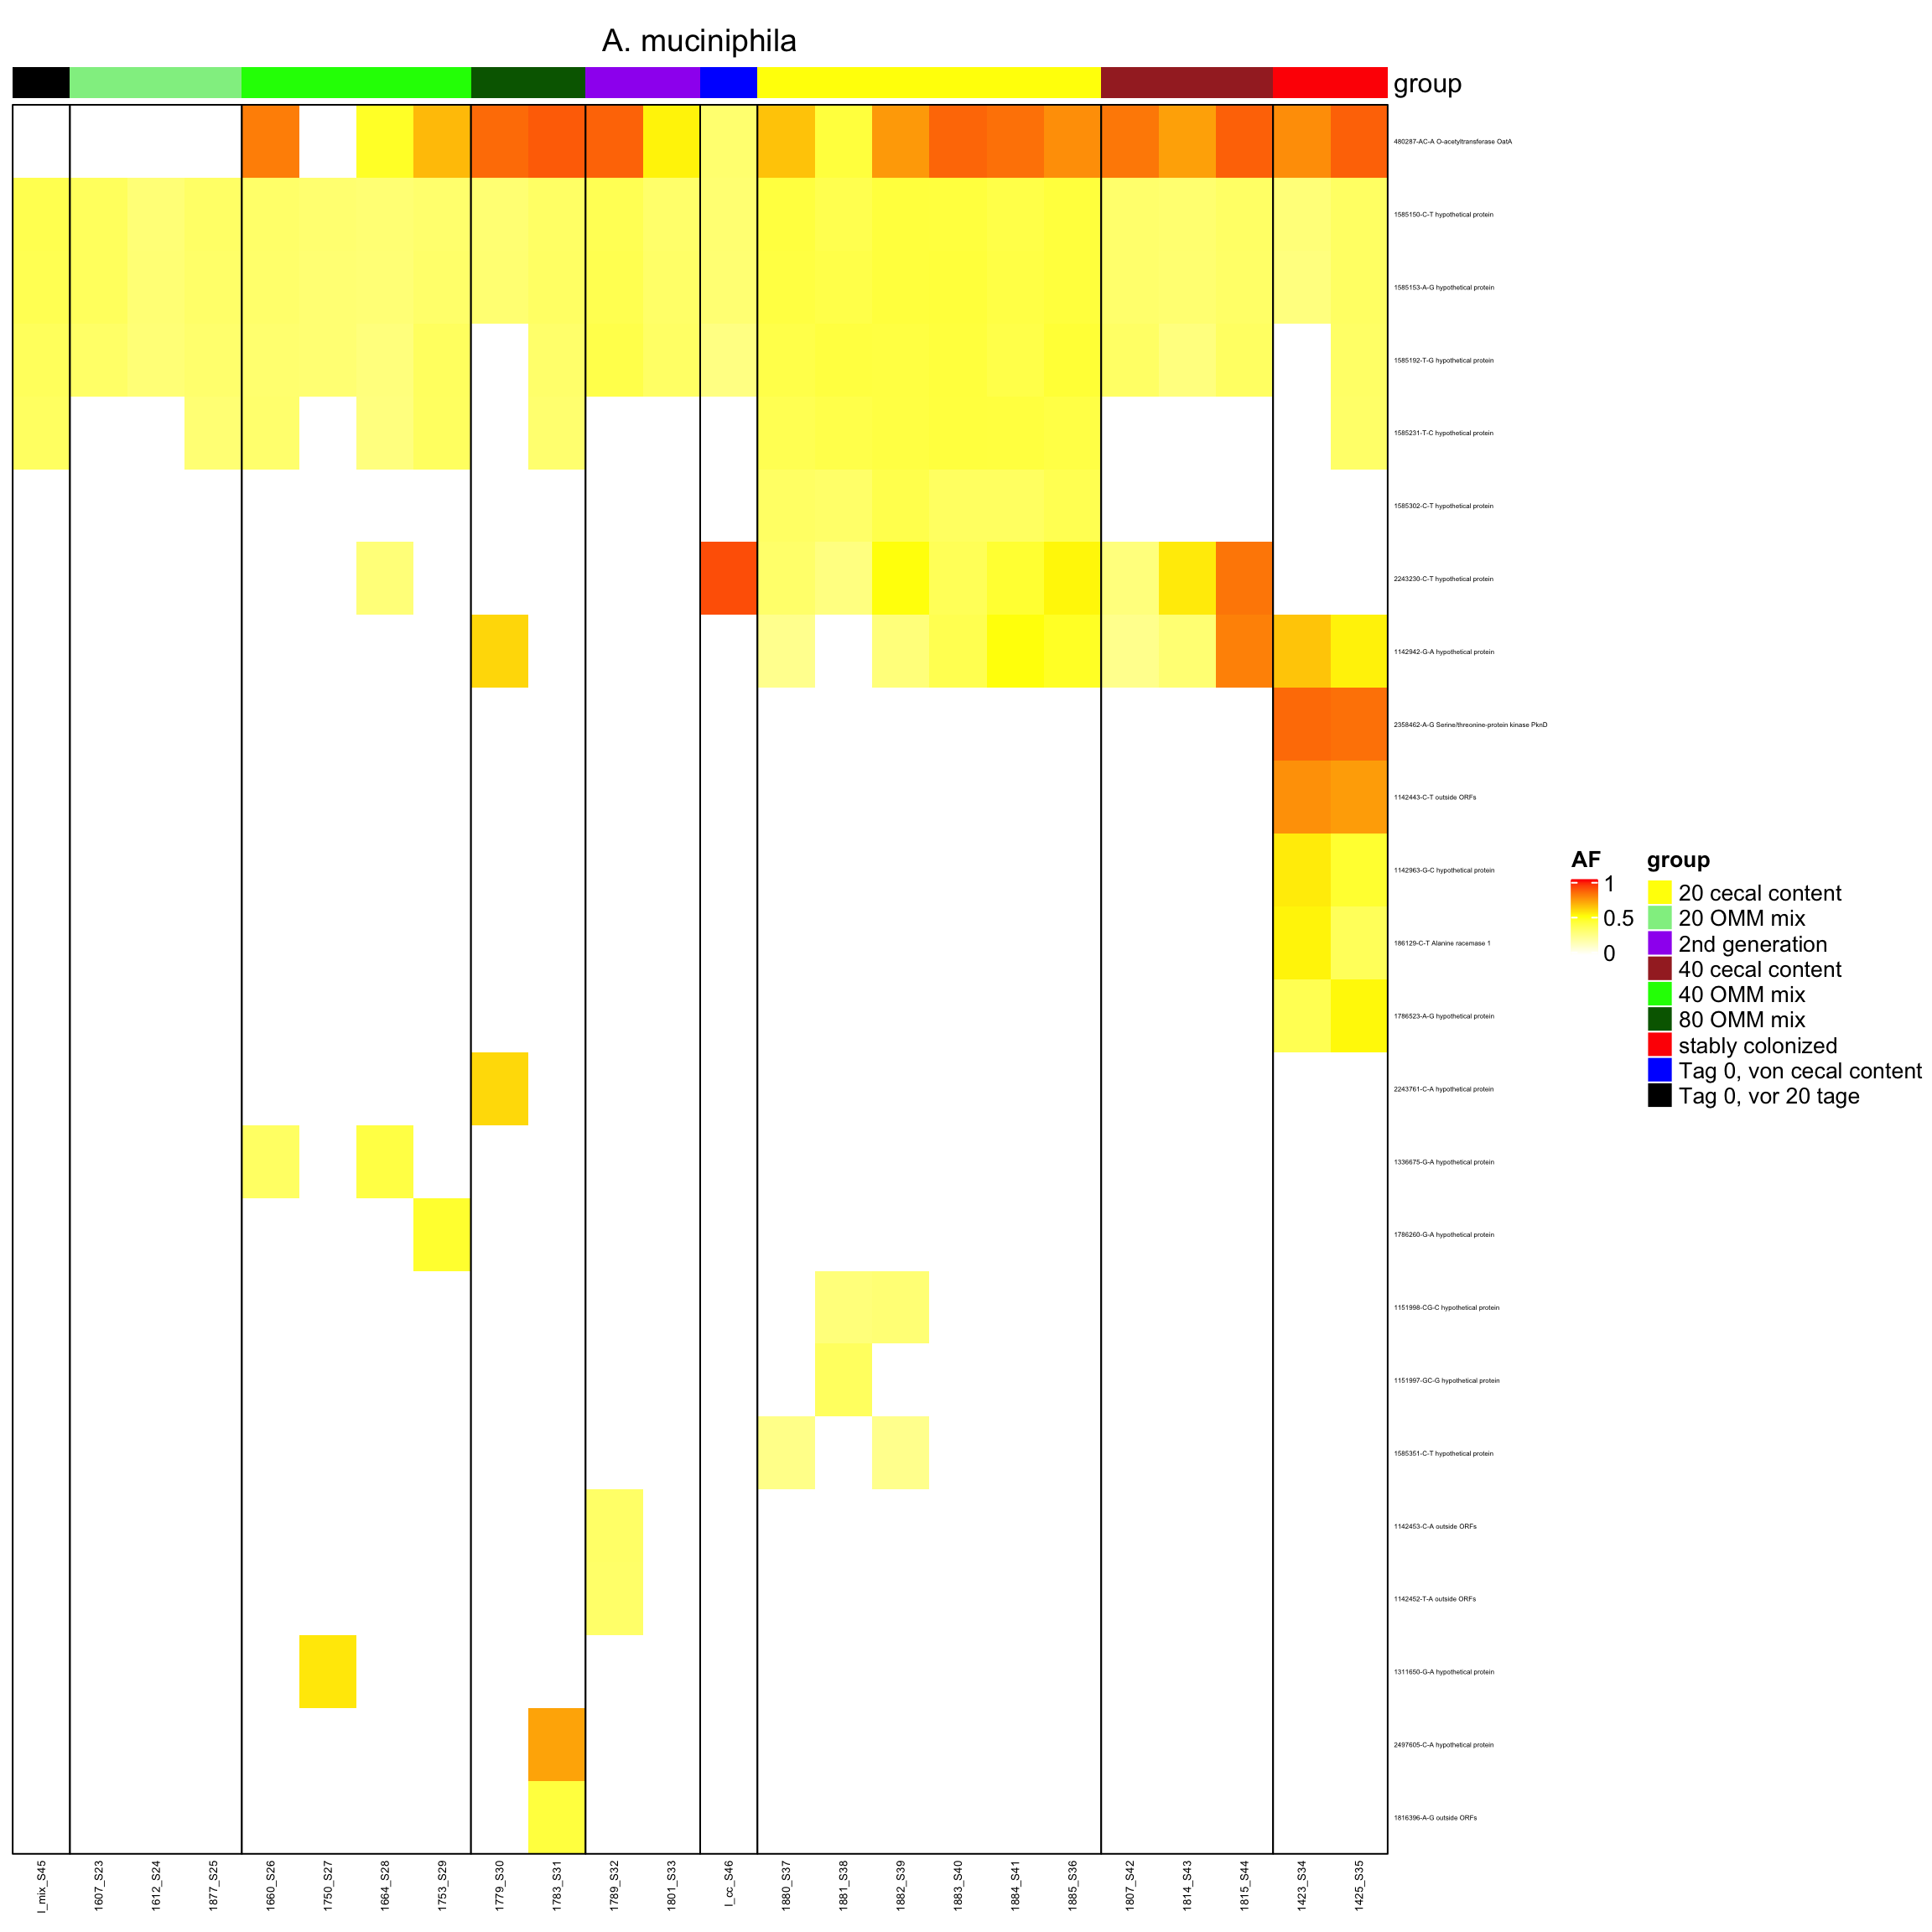
genomeHeat(genome = "A. muciniphila", nohyp = T)
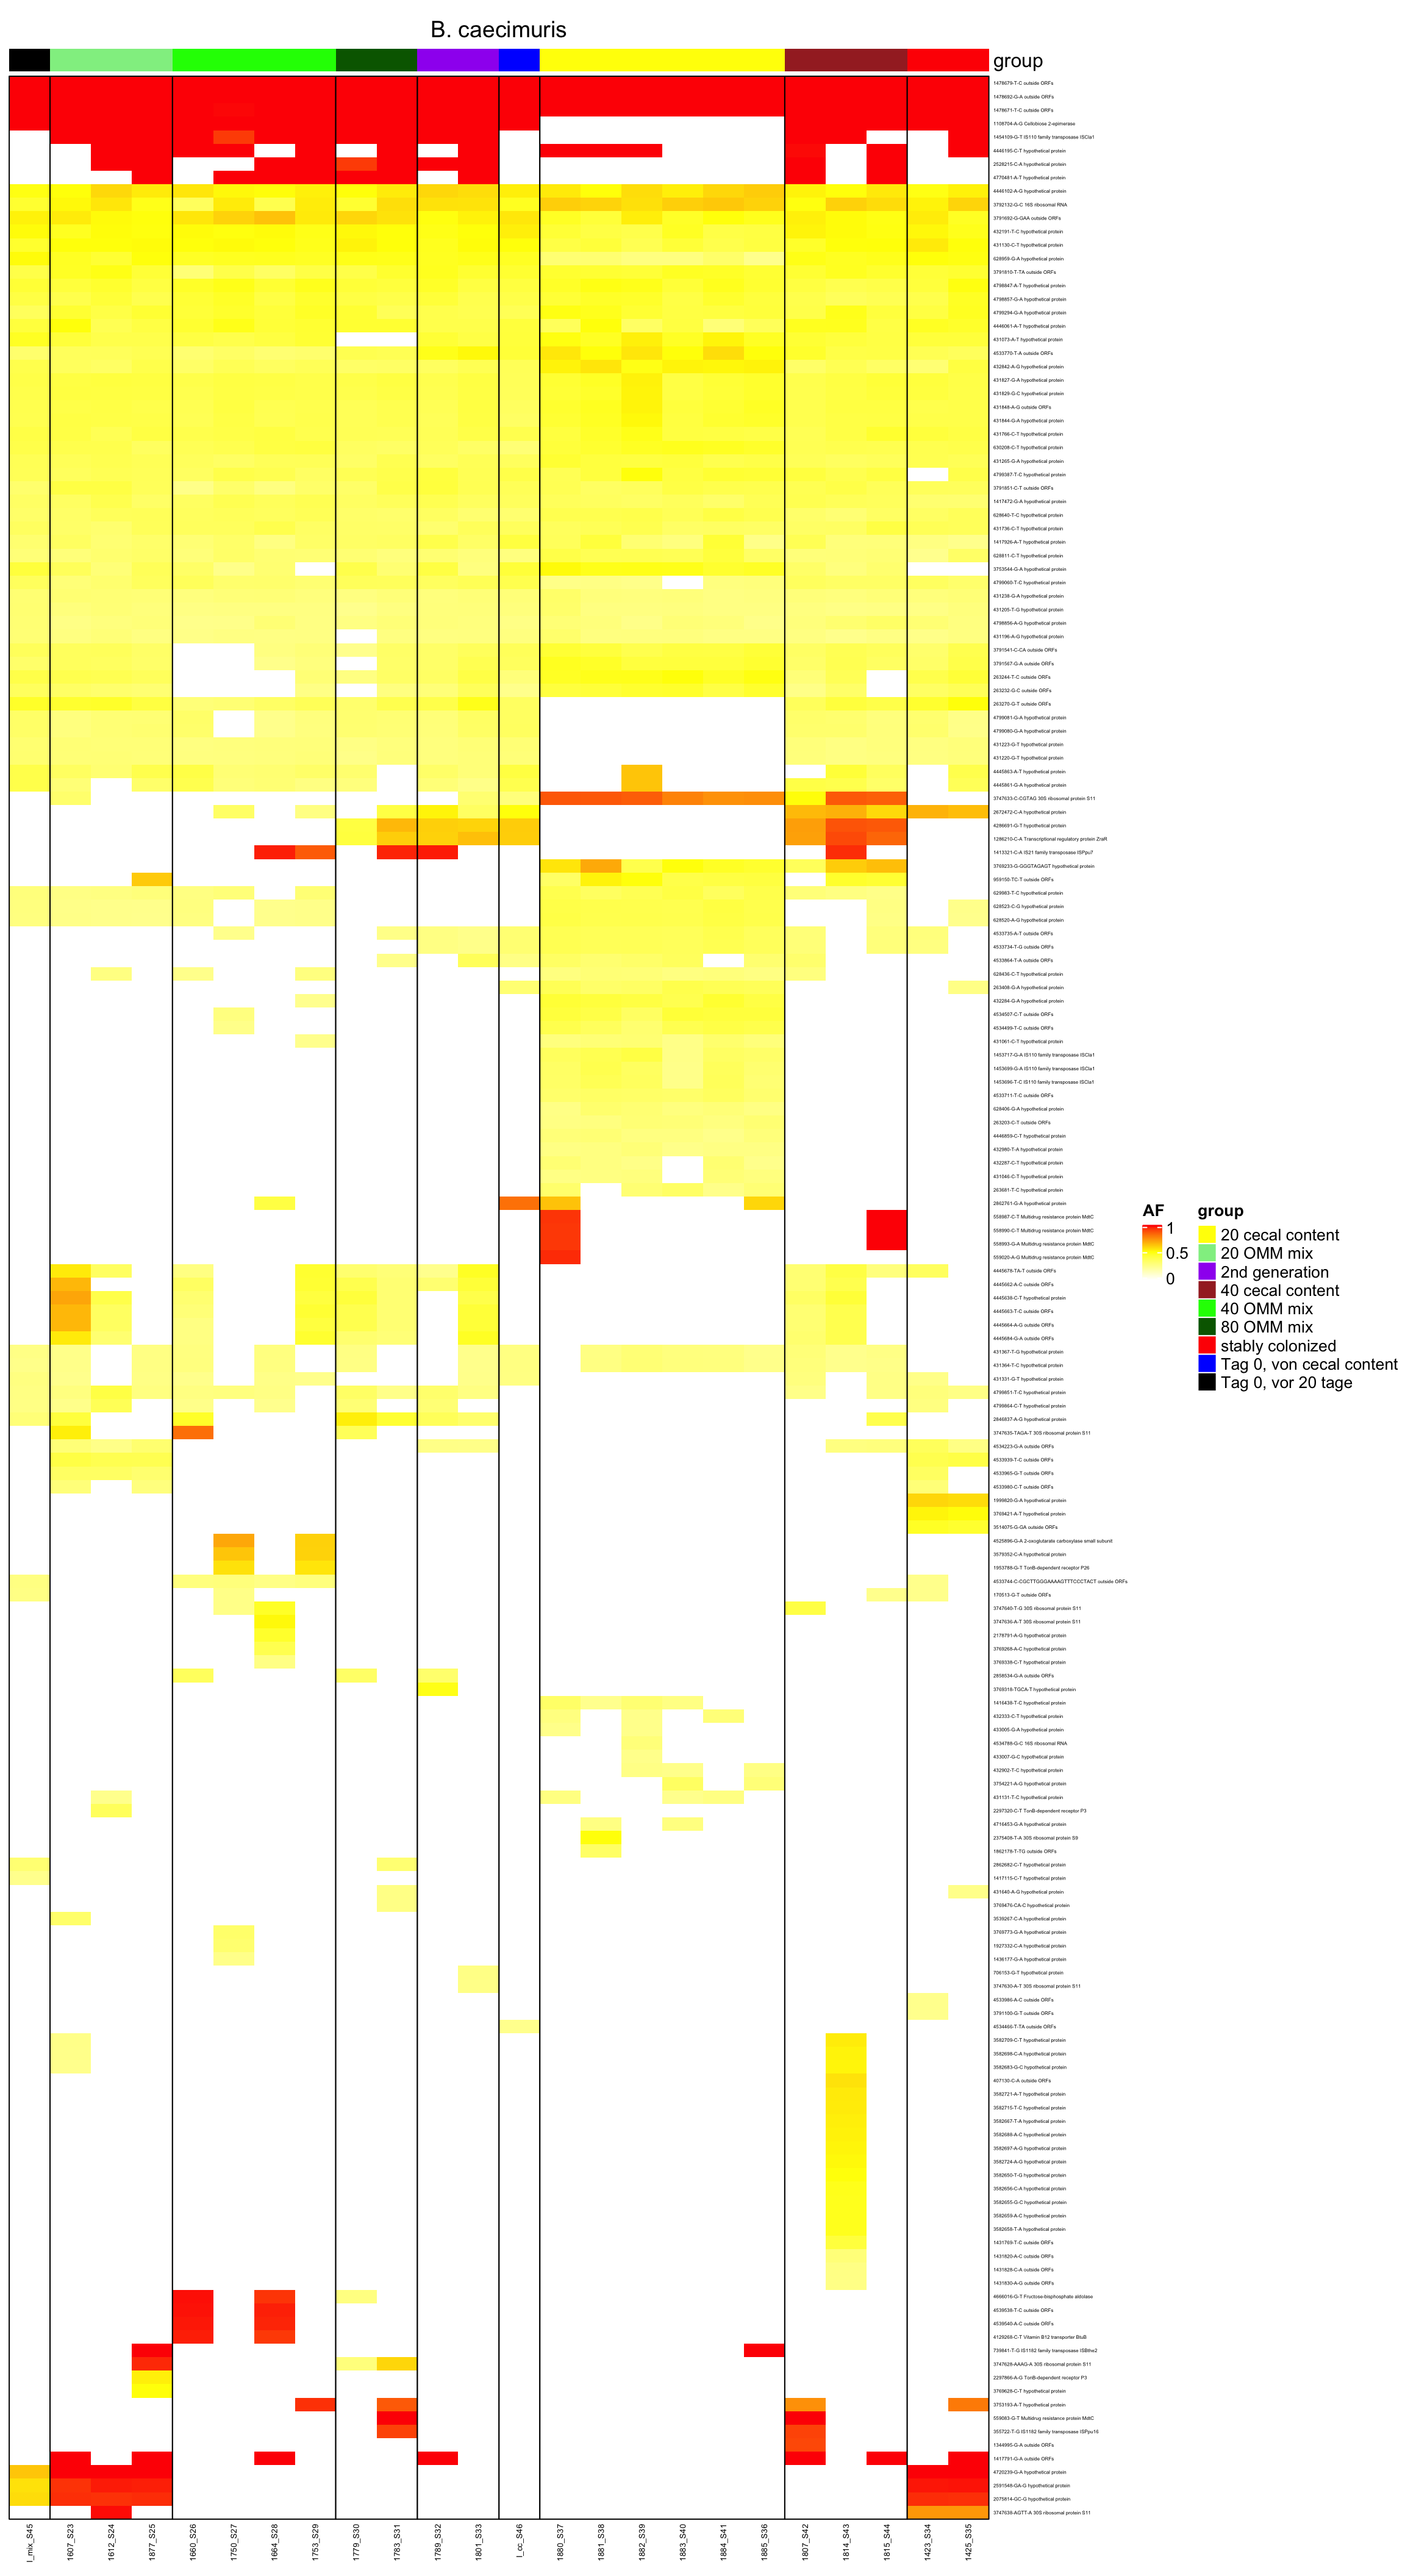
genomeHeat(genome = "B. caecimuris", nohyp = T)
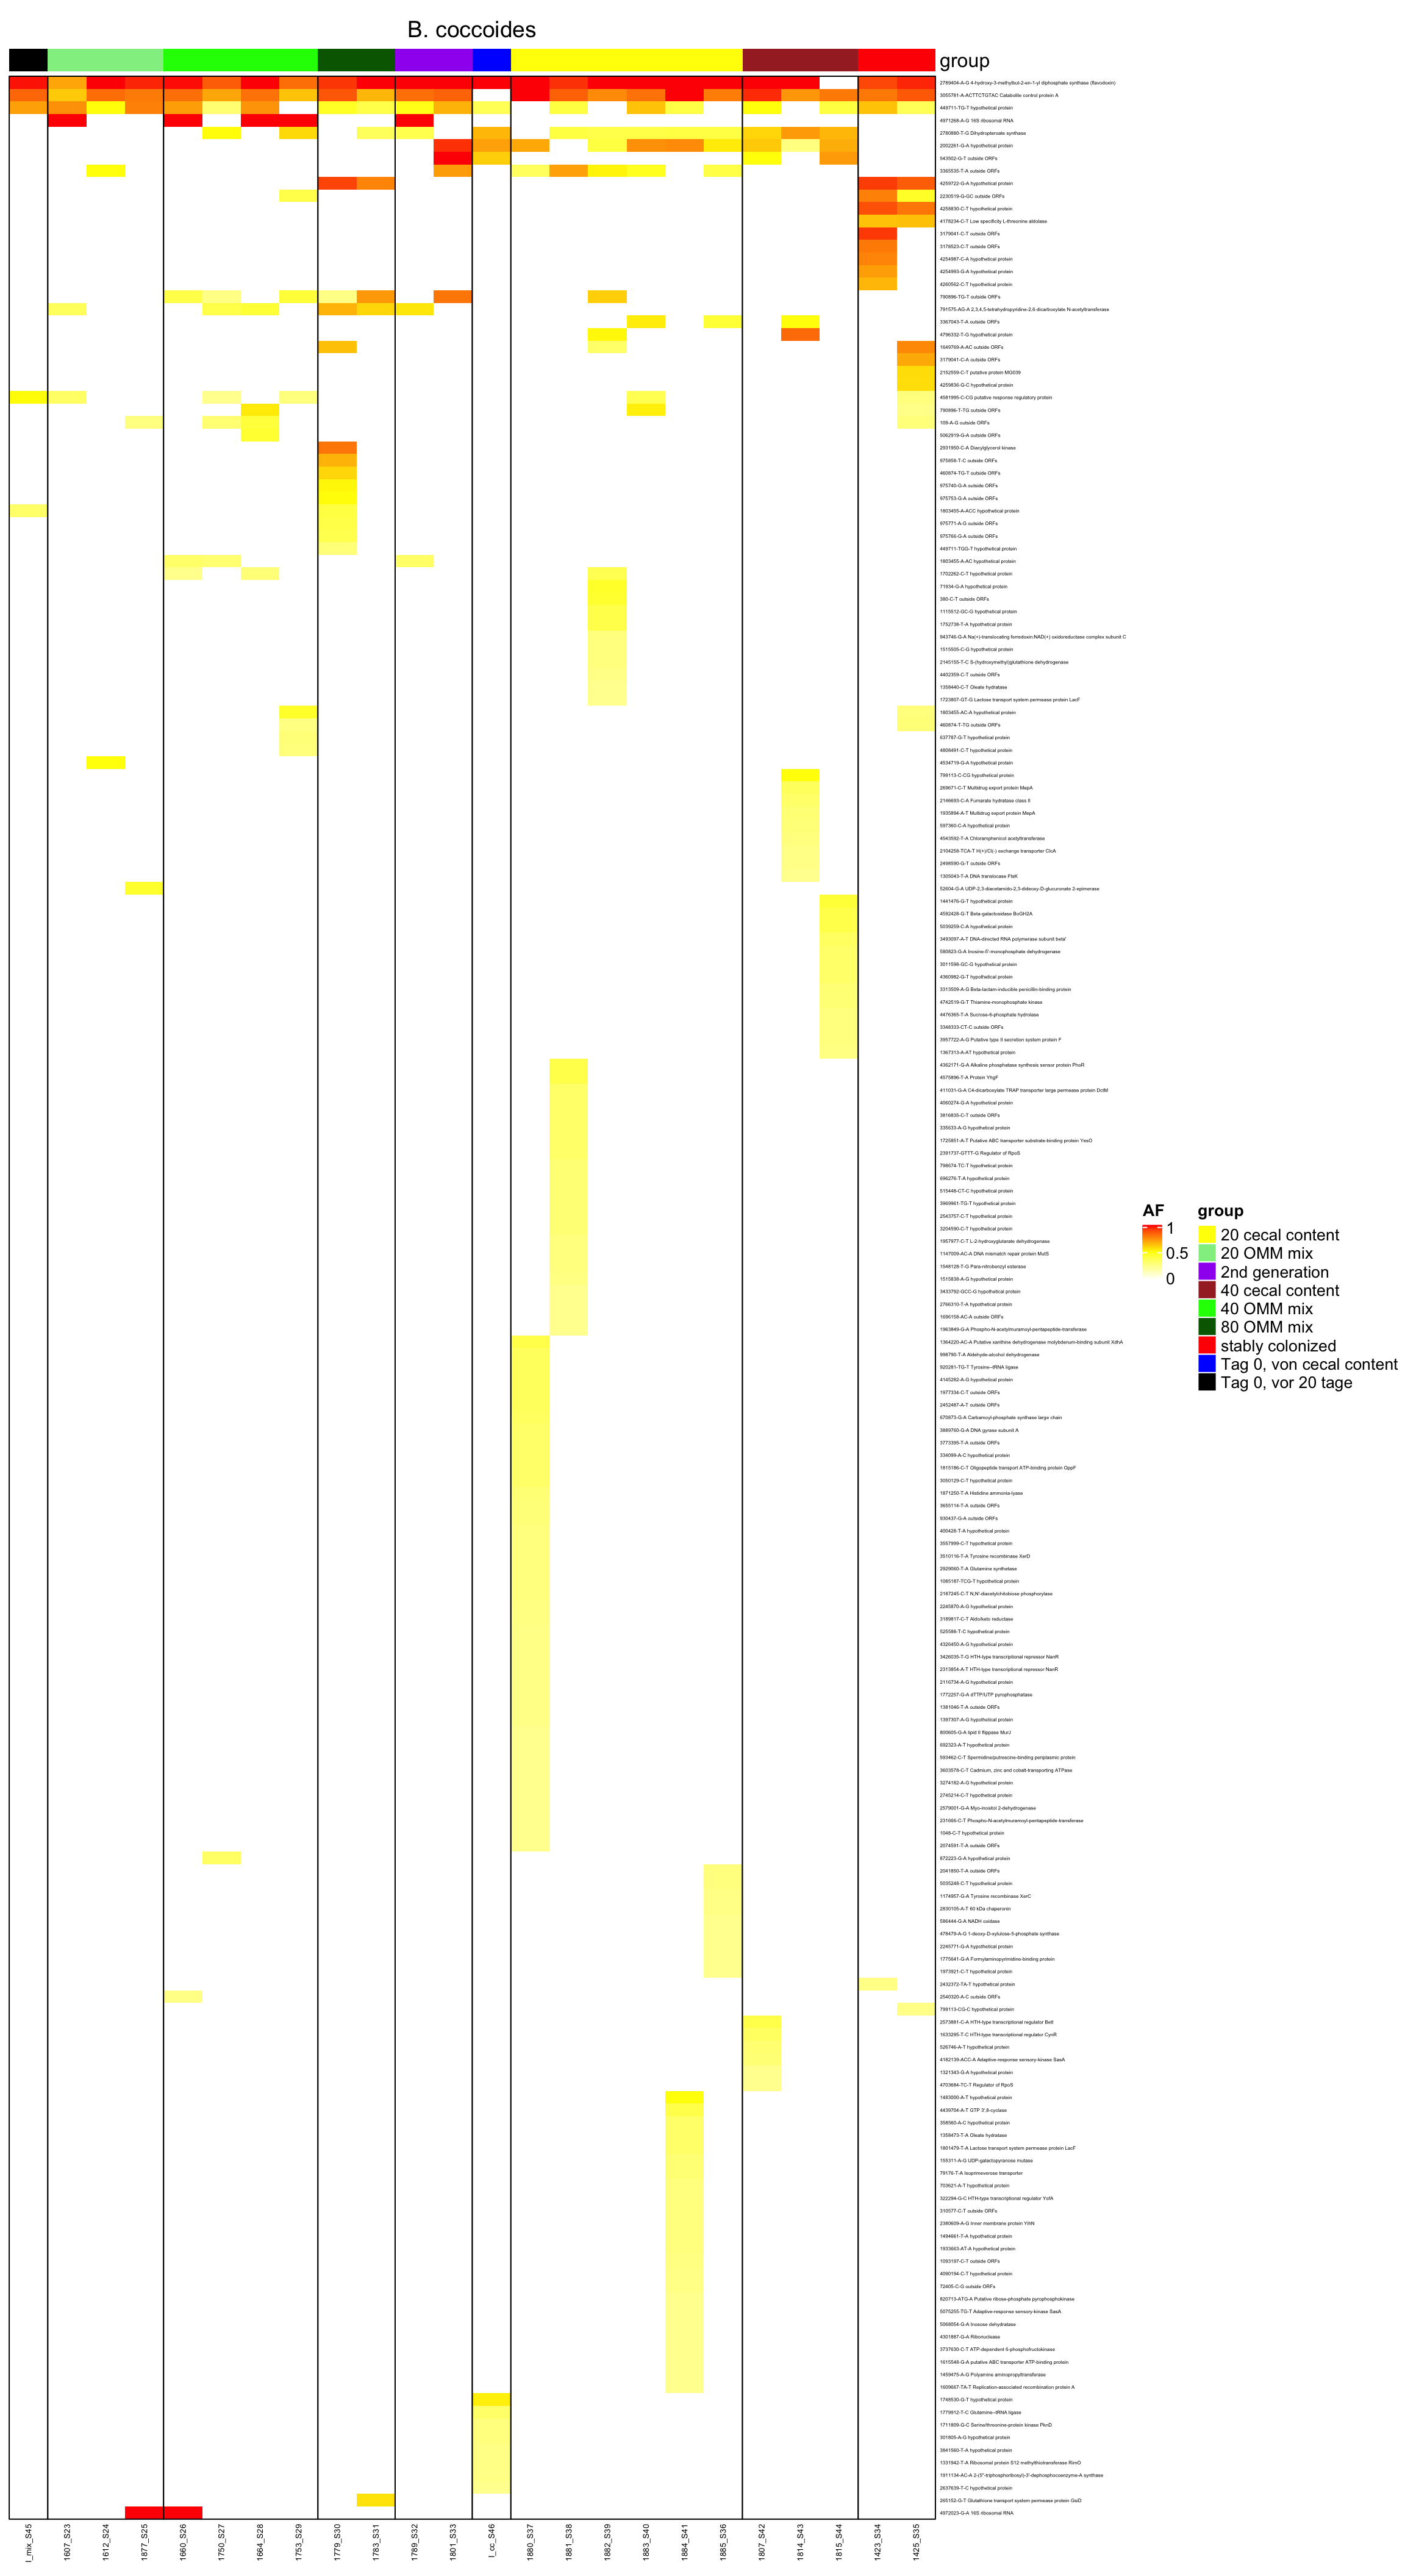
genomeHeat(genome = "B. coccoides", nohyp = T)
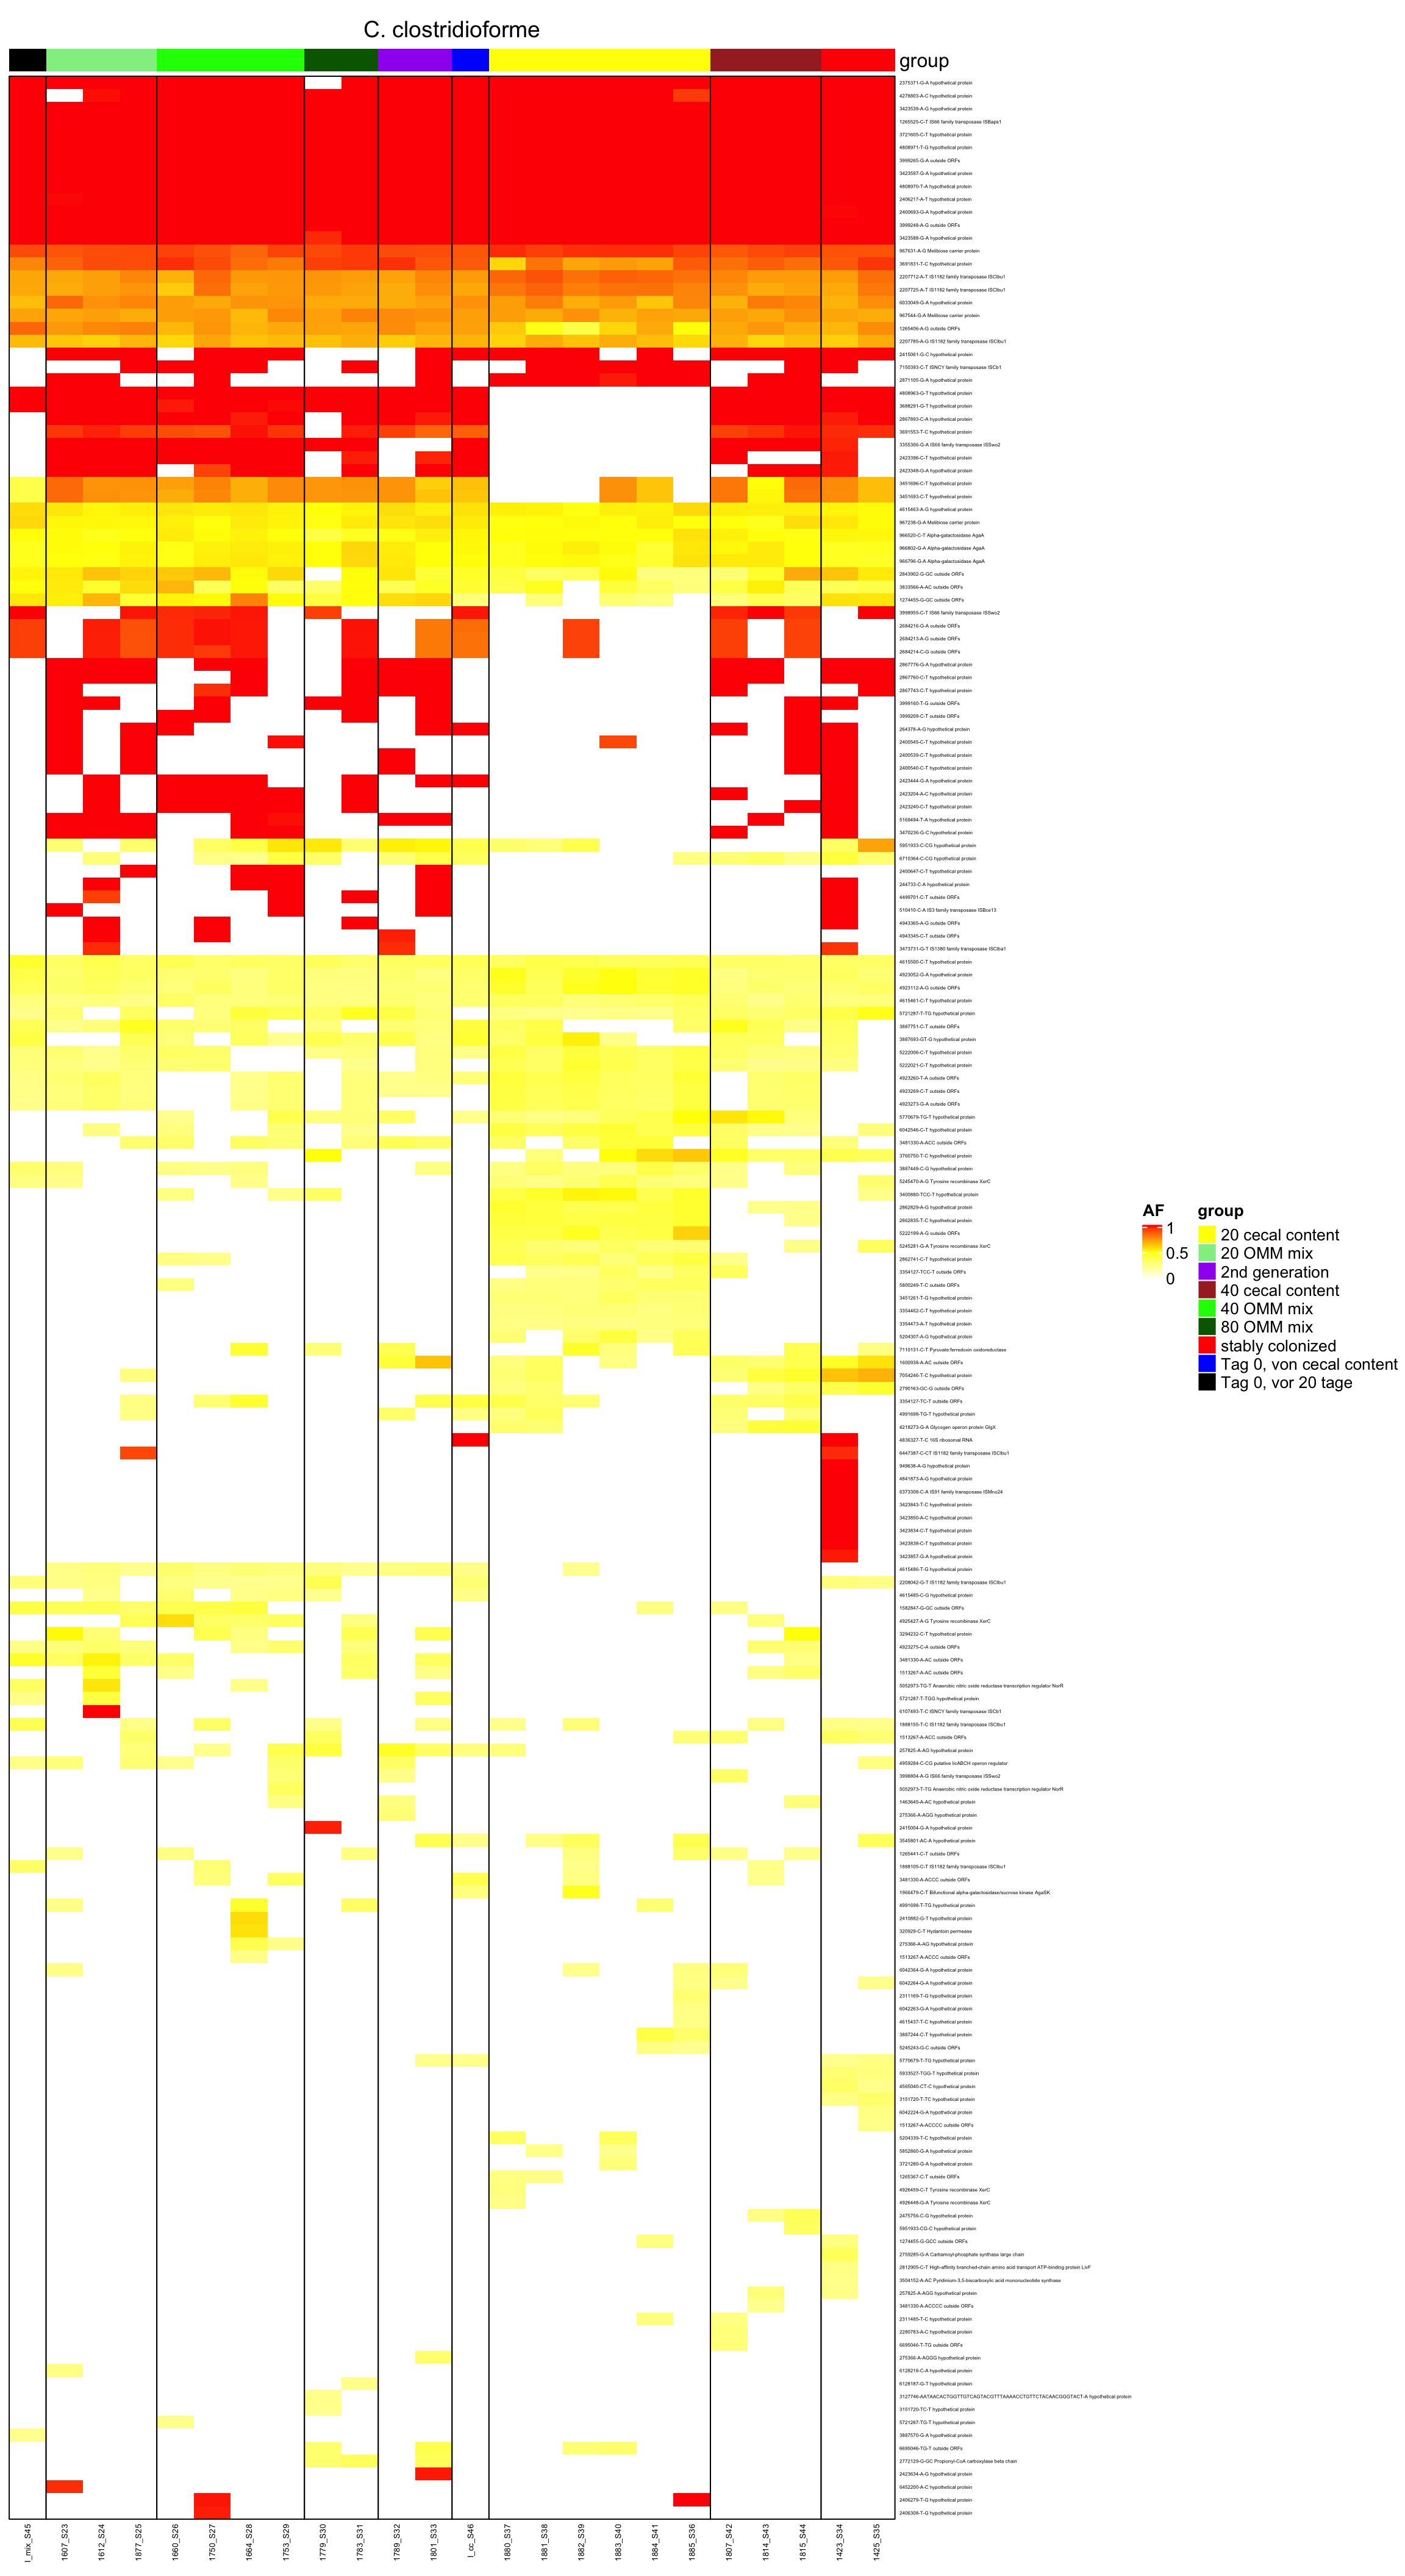
genomeHeat(genome = "C. clostridioforme", nohyp = T)
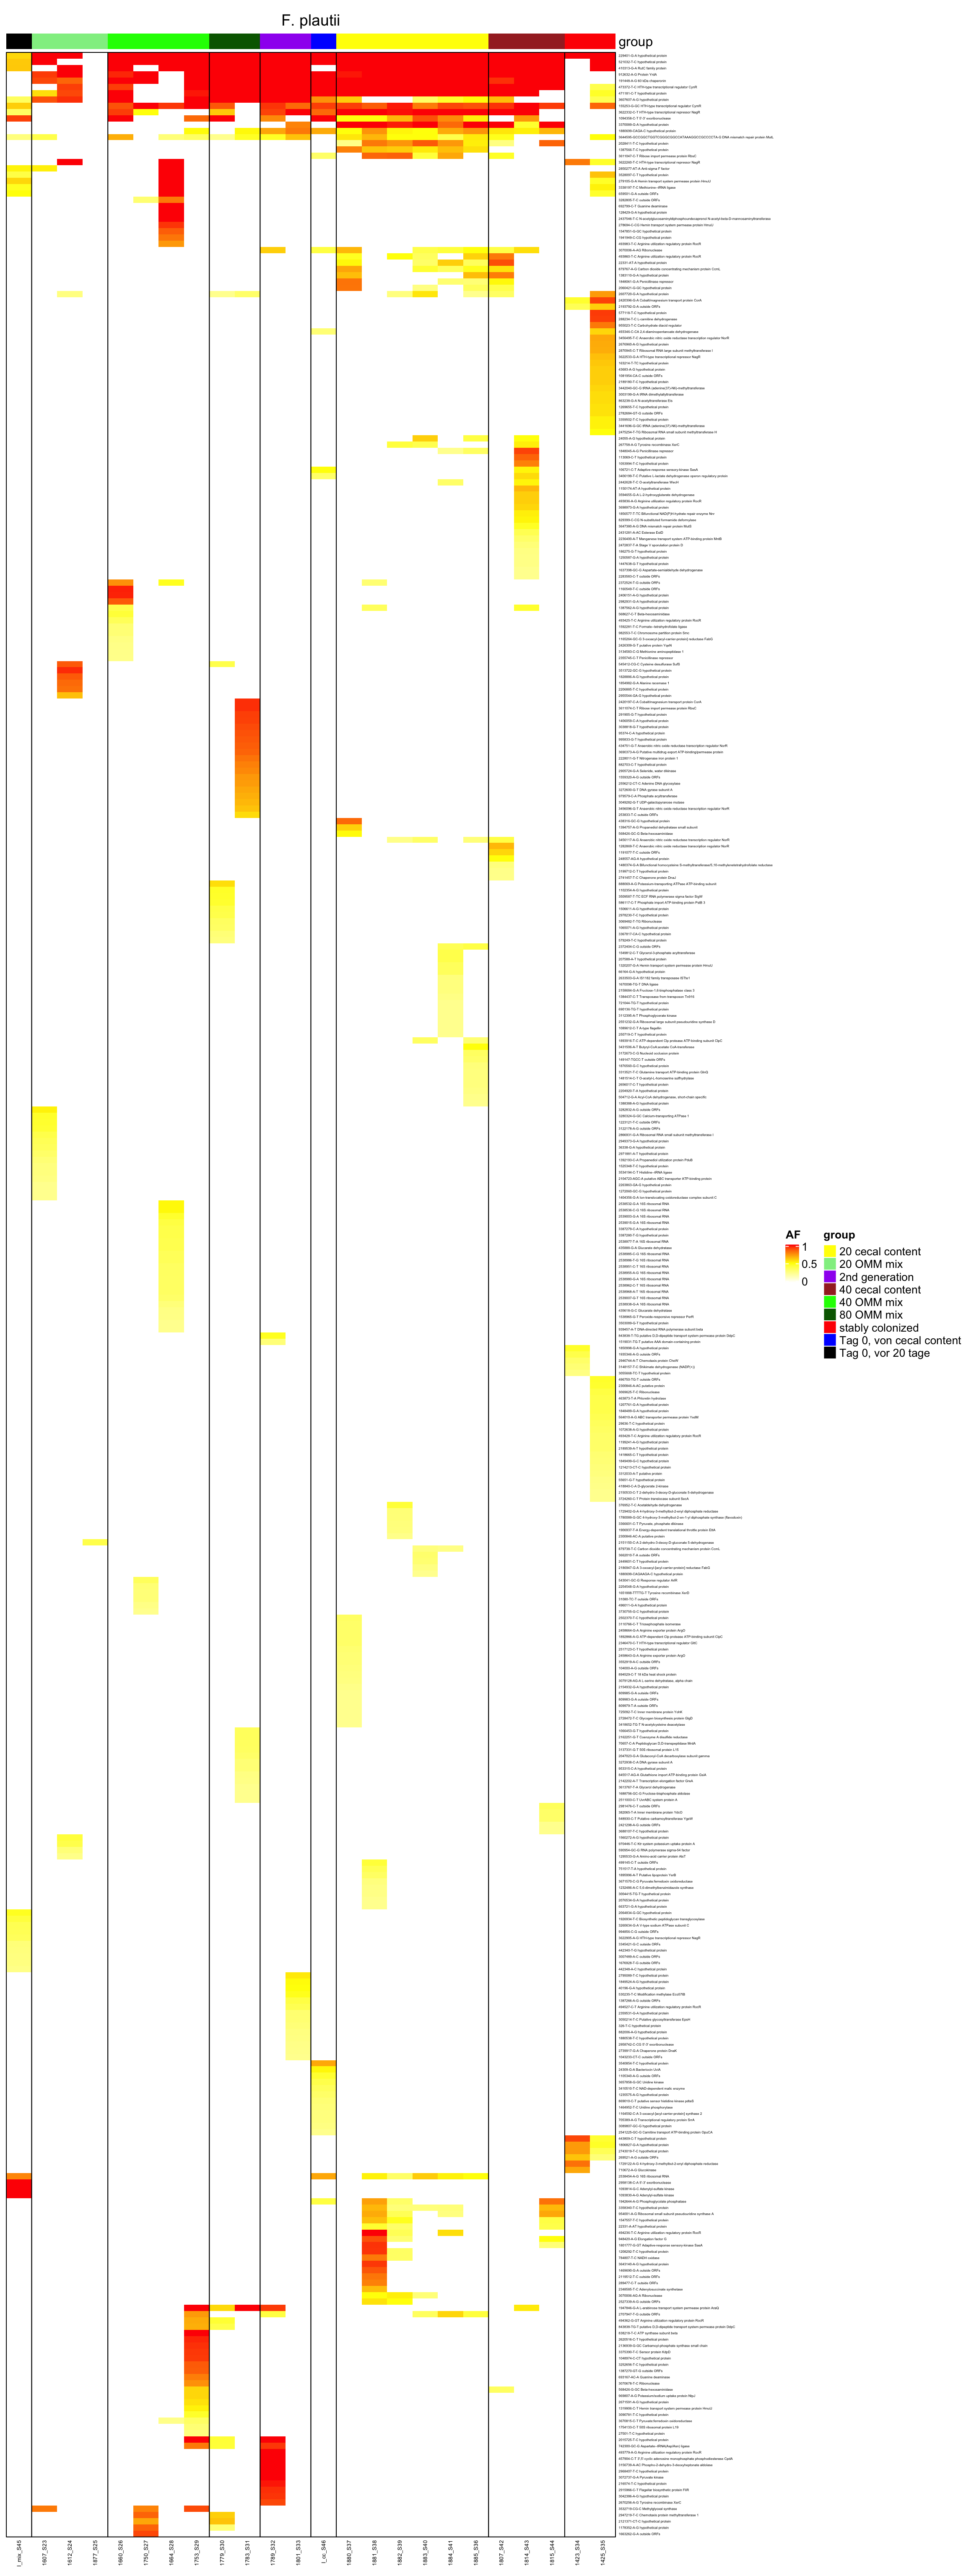
genomeHeat(genome = "F. plautii", nohyp = T)
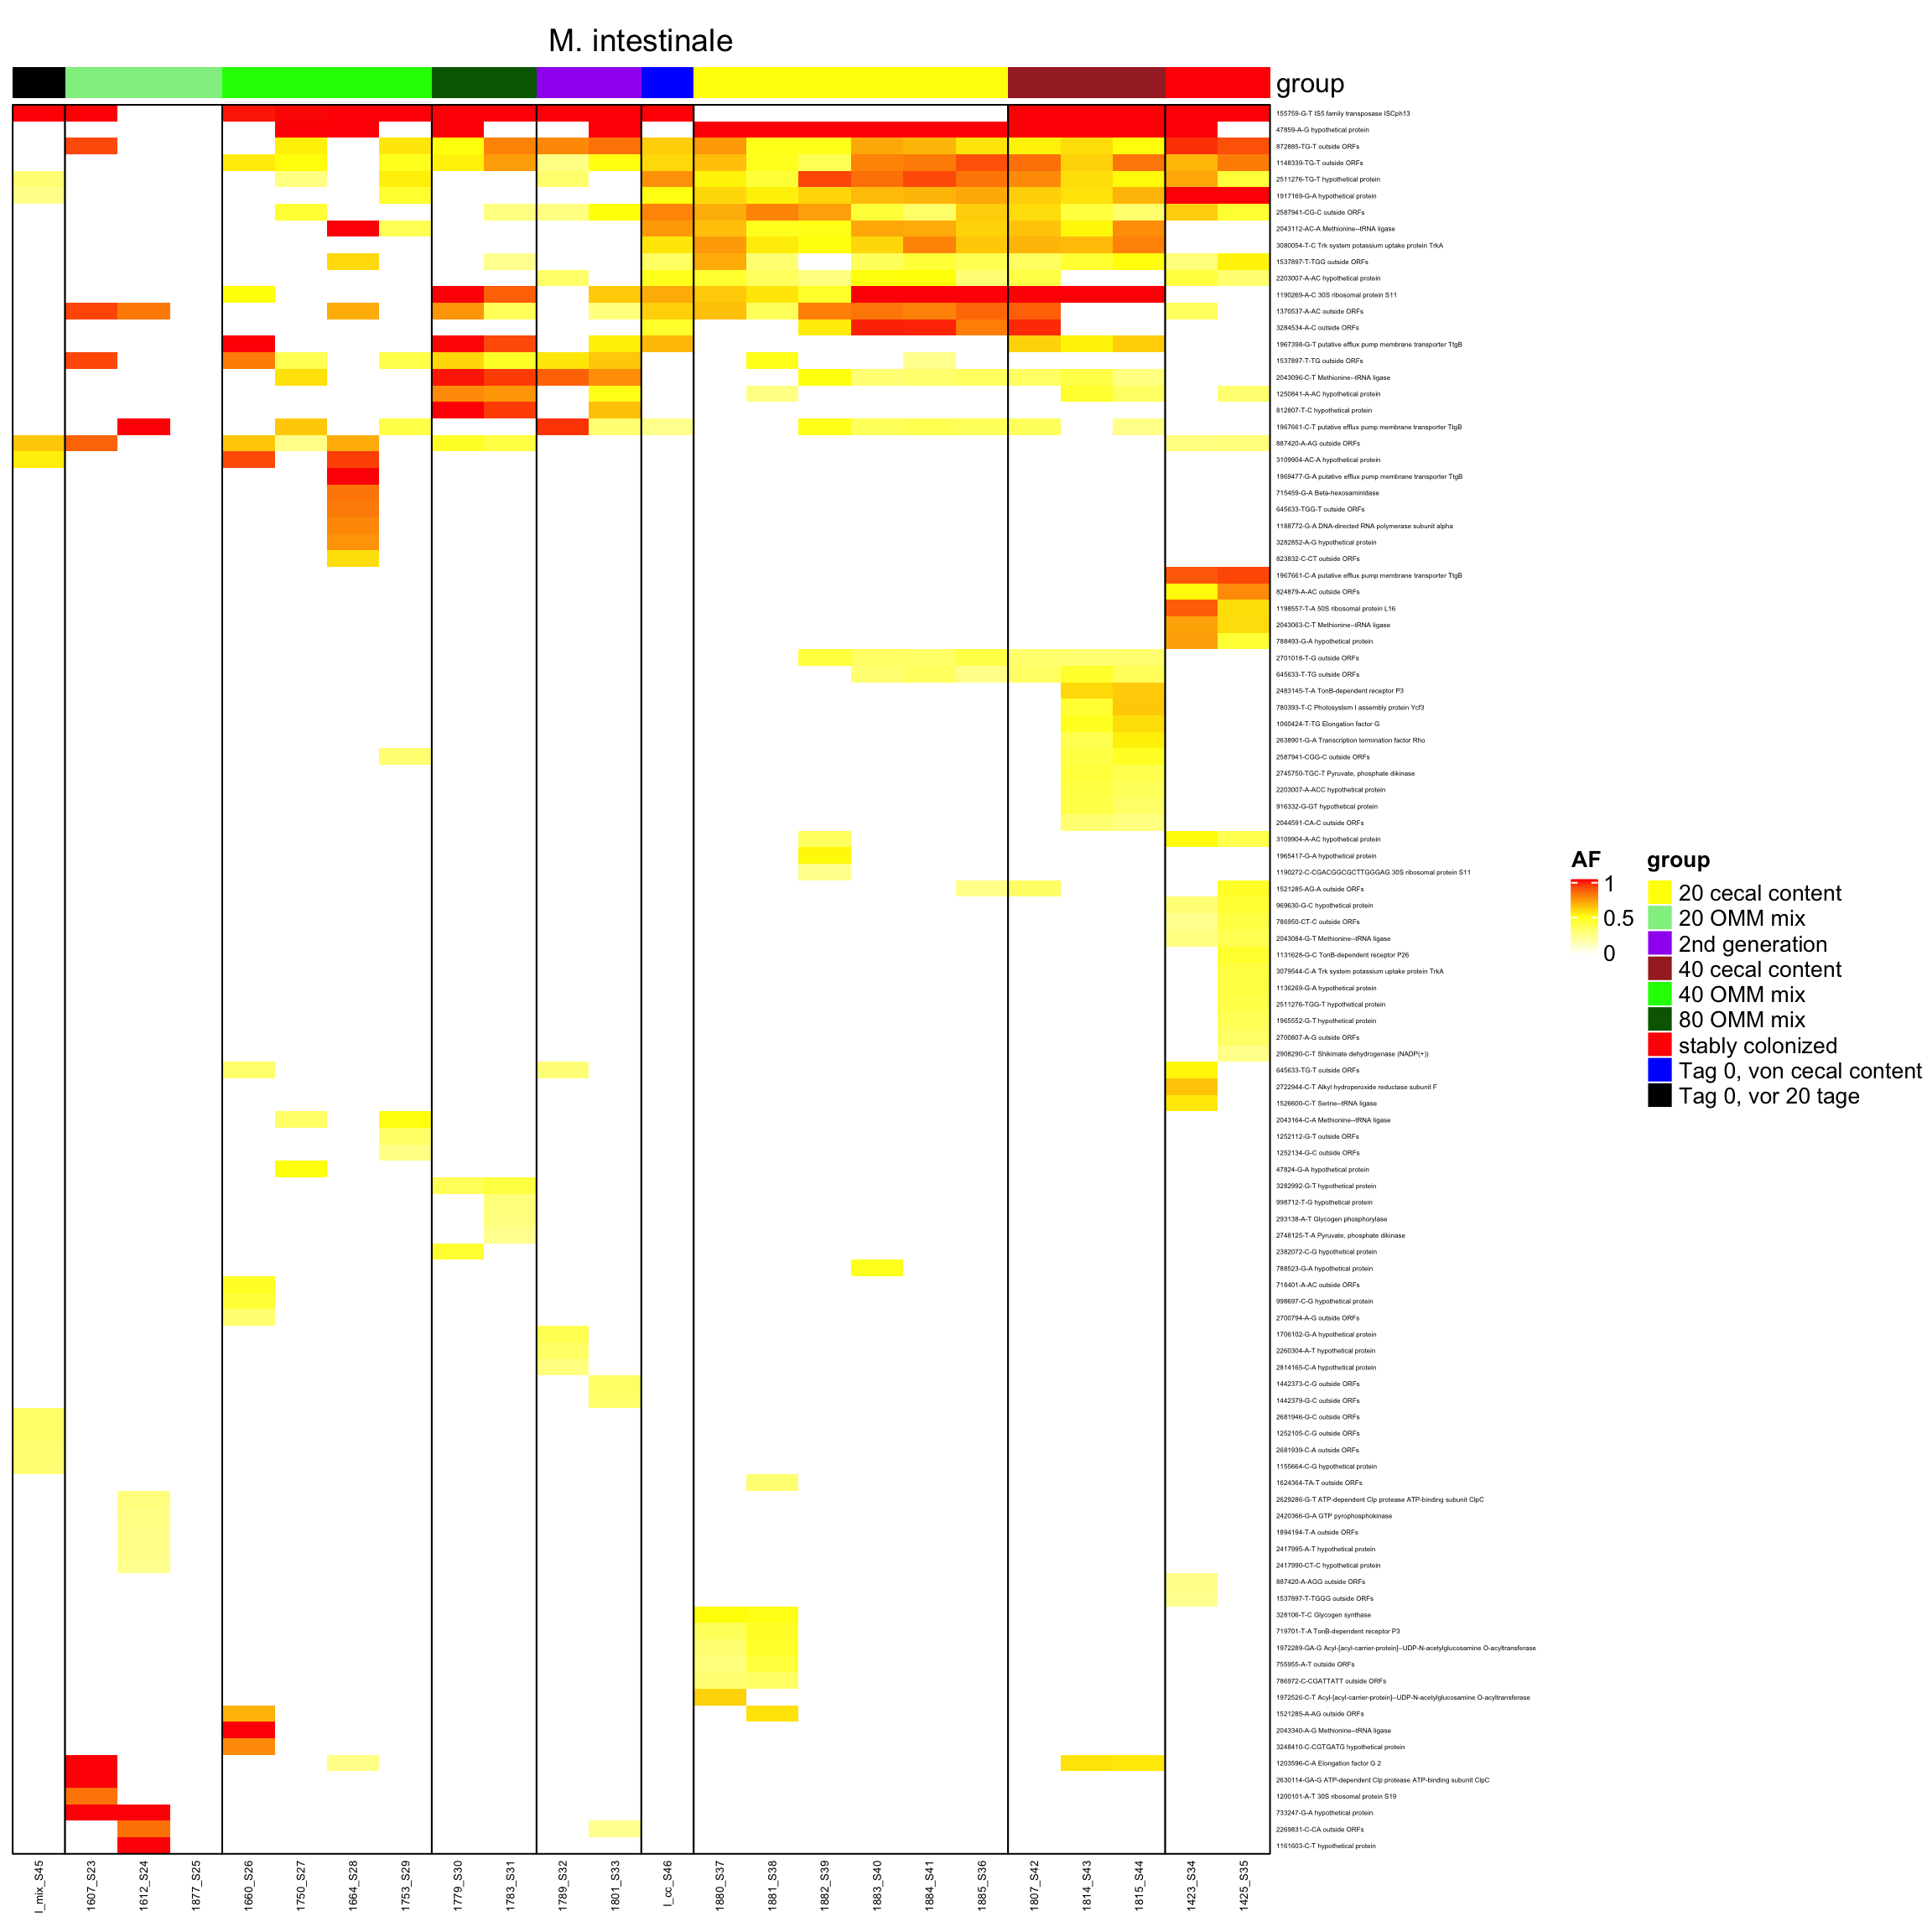
genomeHeat(genome = "M. intestinale", nohyp = T)
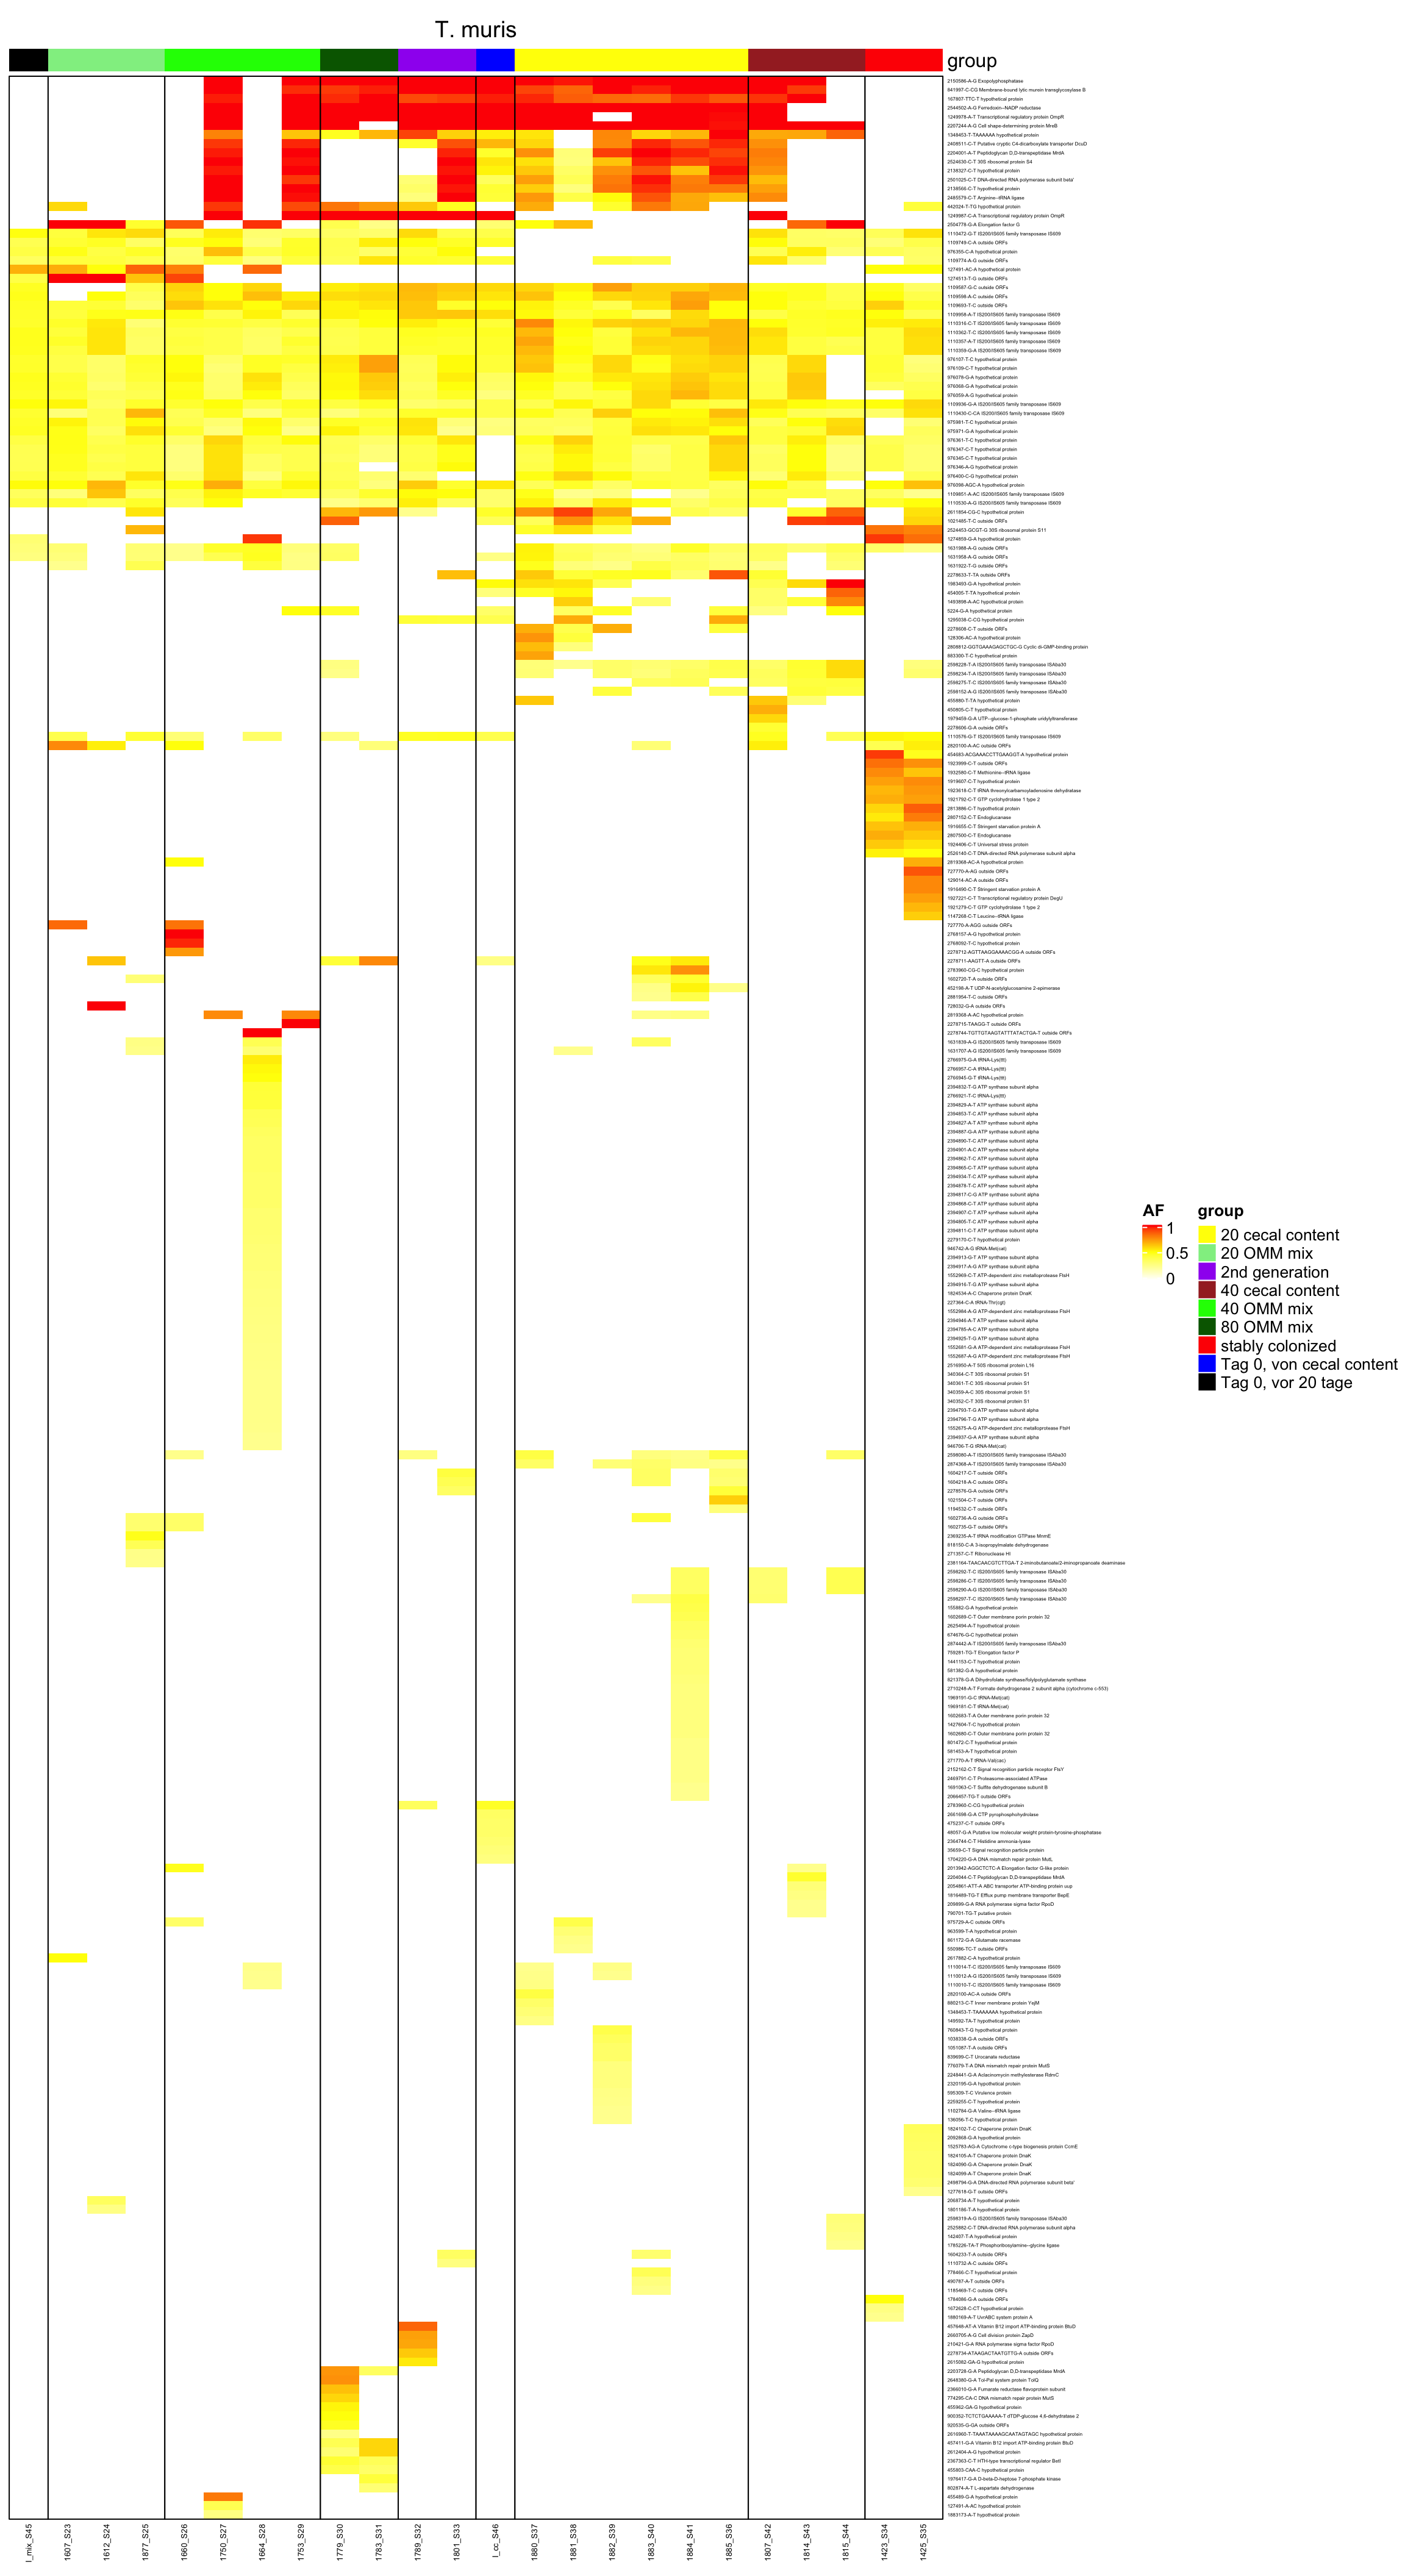
genomeHeat(genome = "T. muris", nohyp = T)
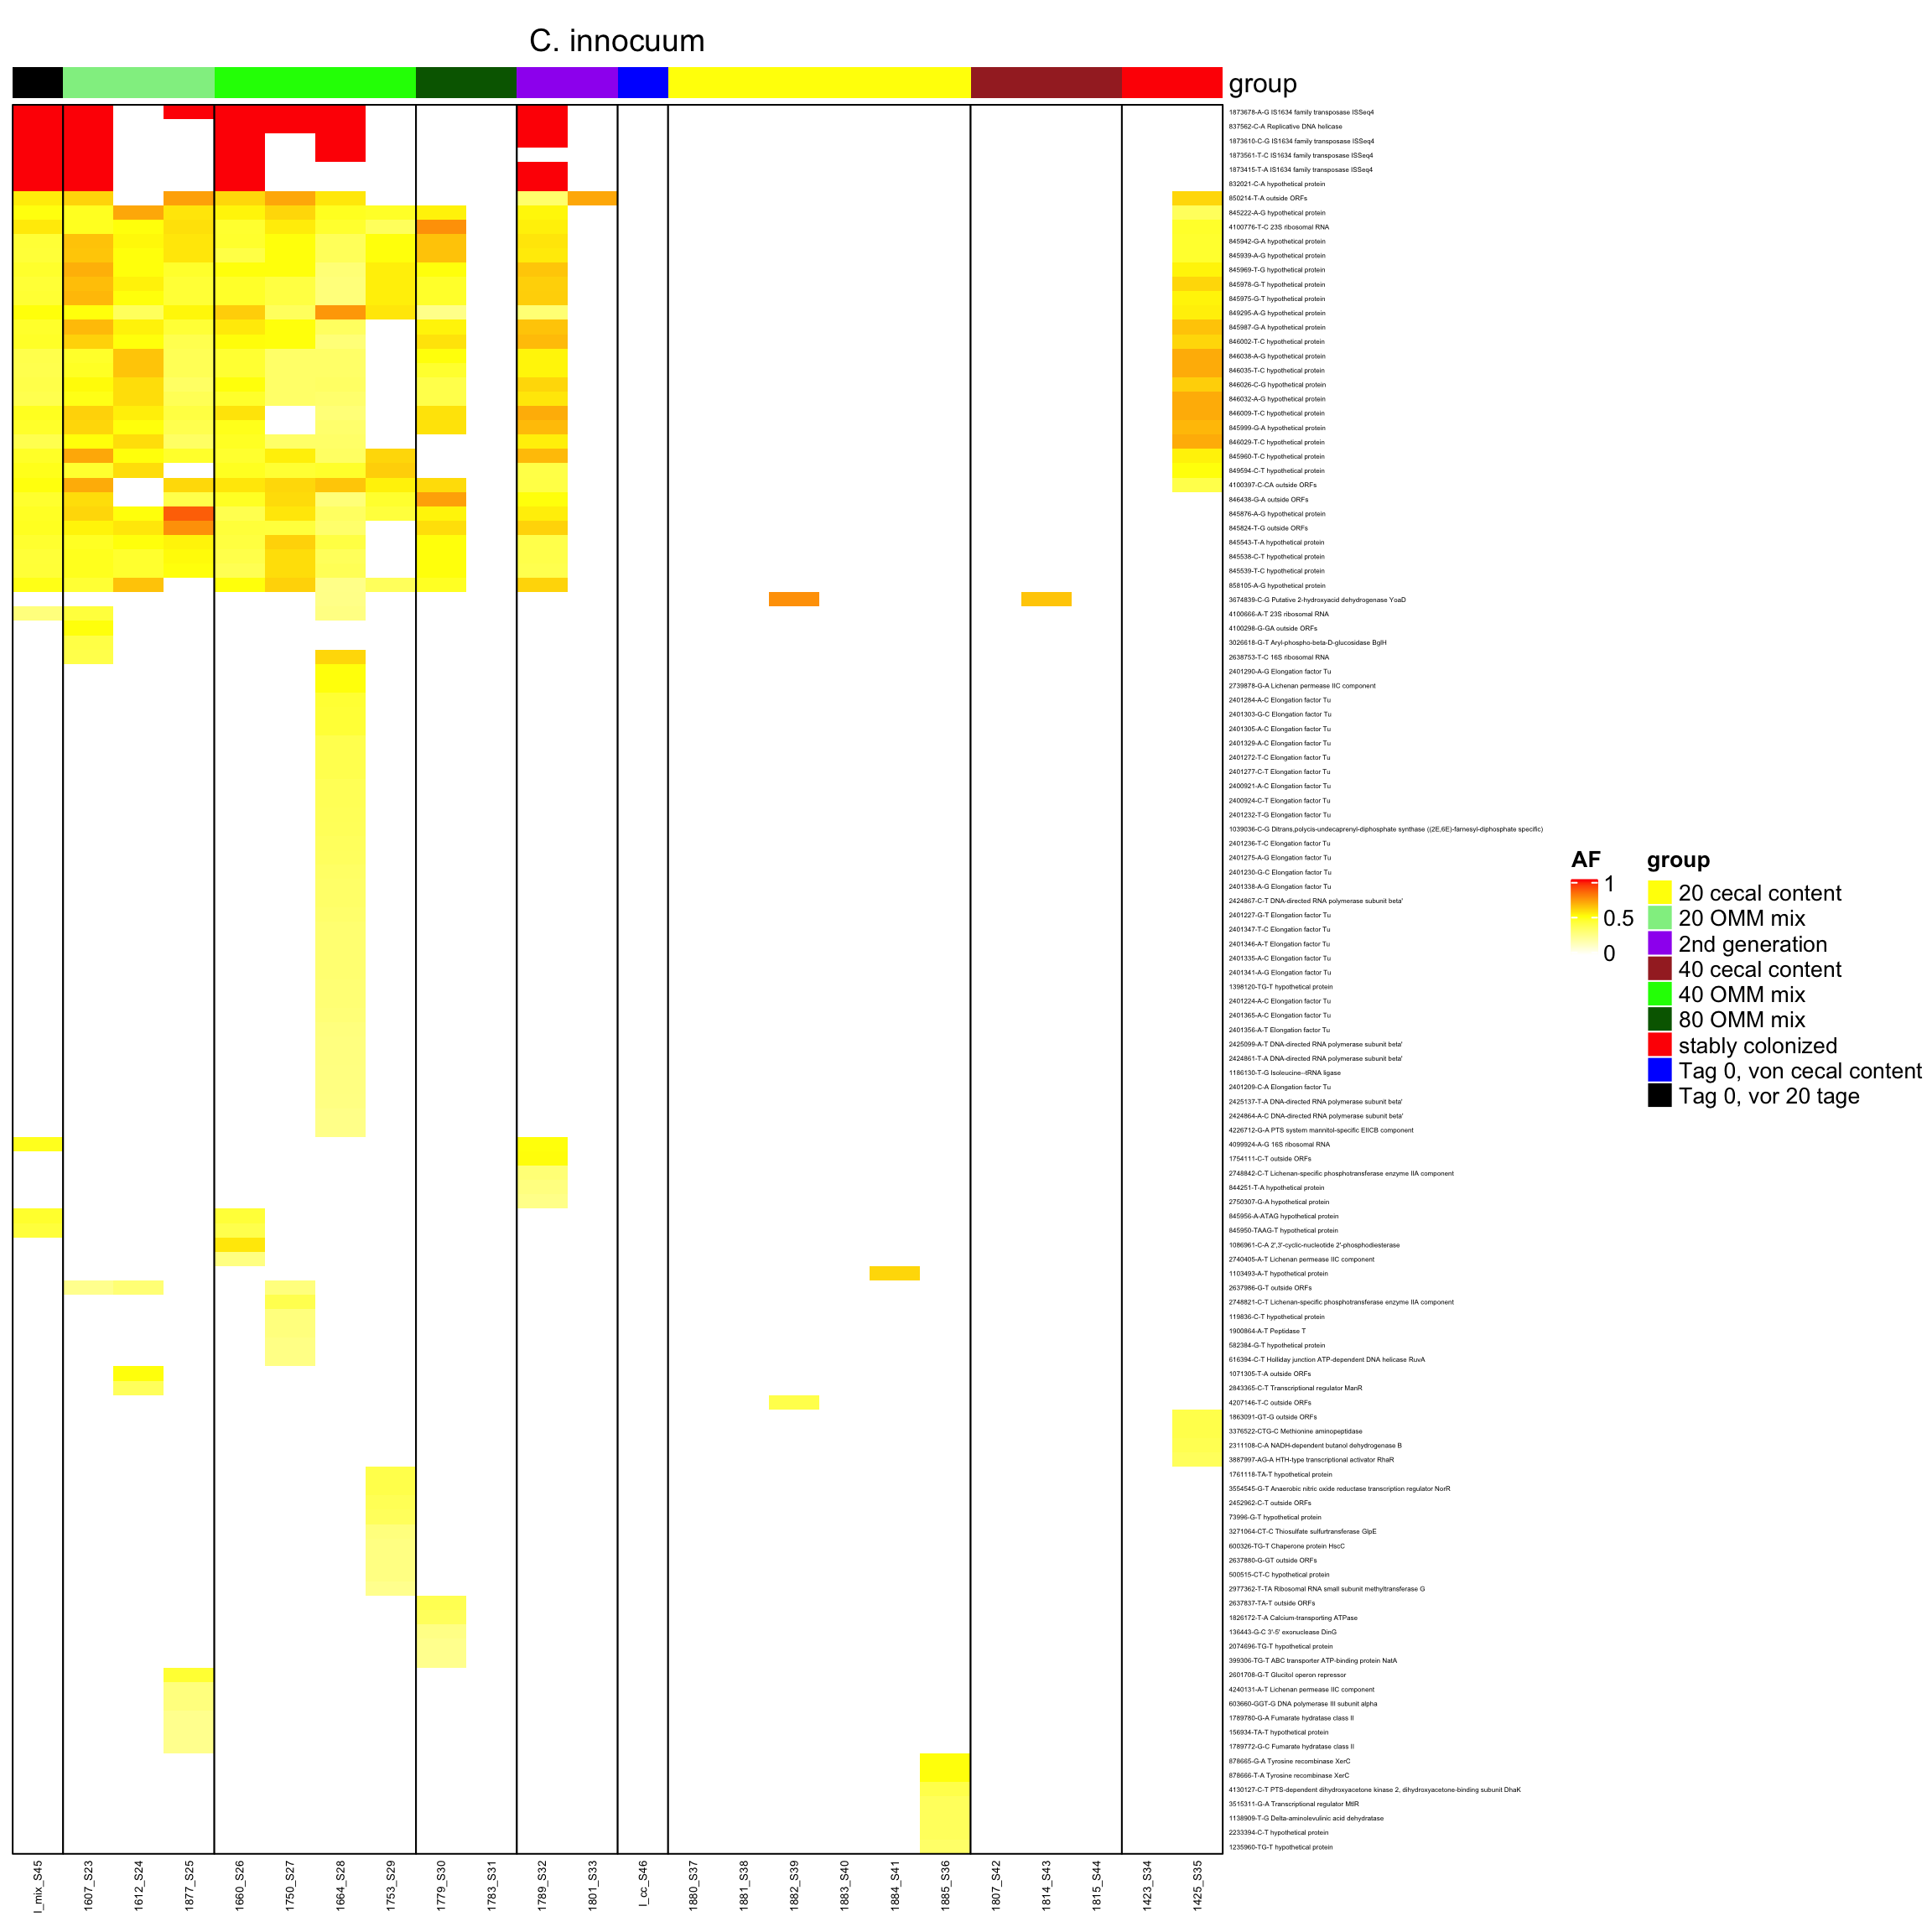
genomeHeat(genome = "C. innocuum", nohyp = T)
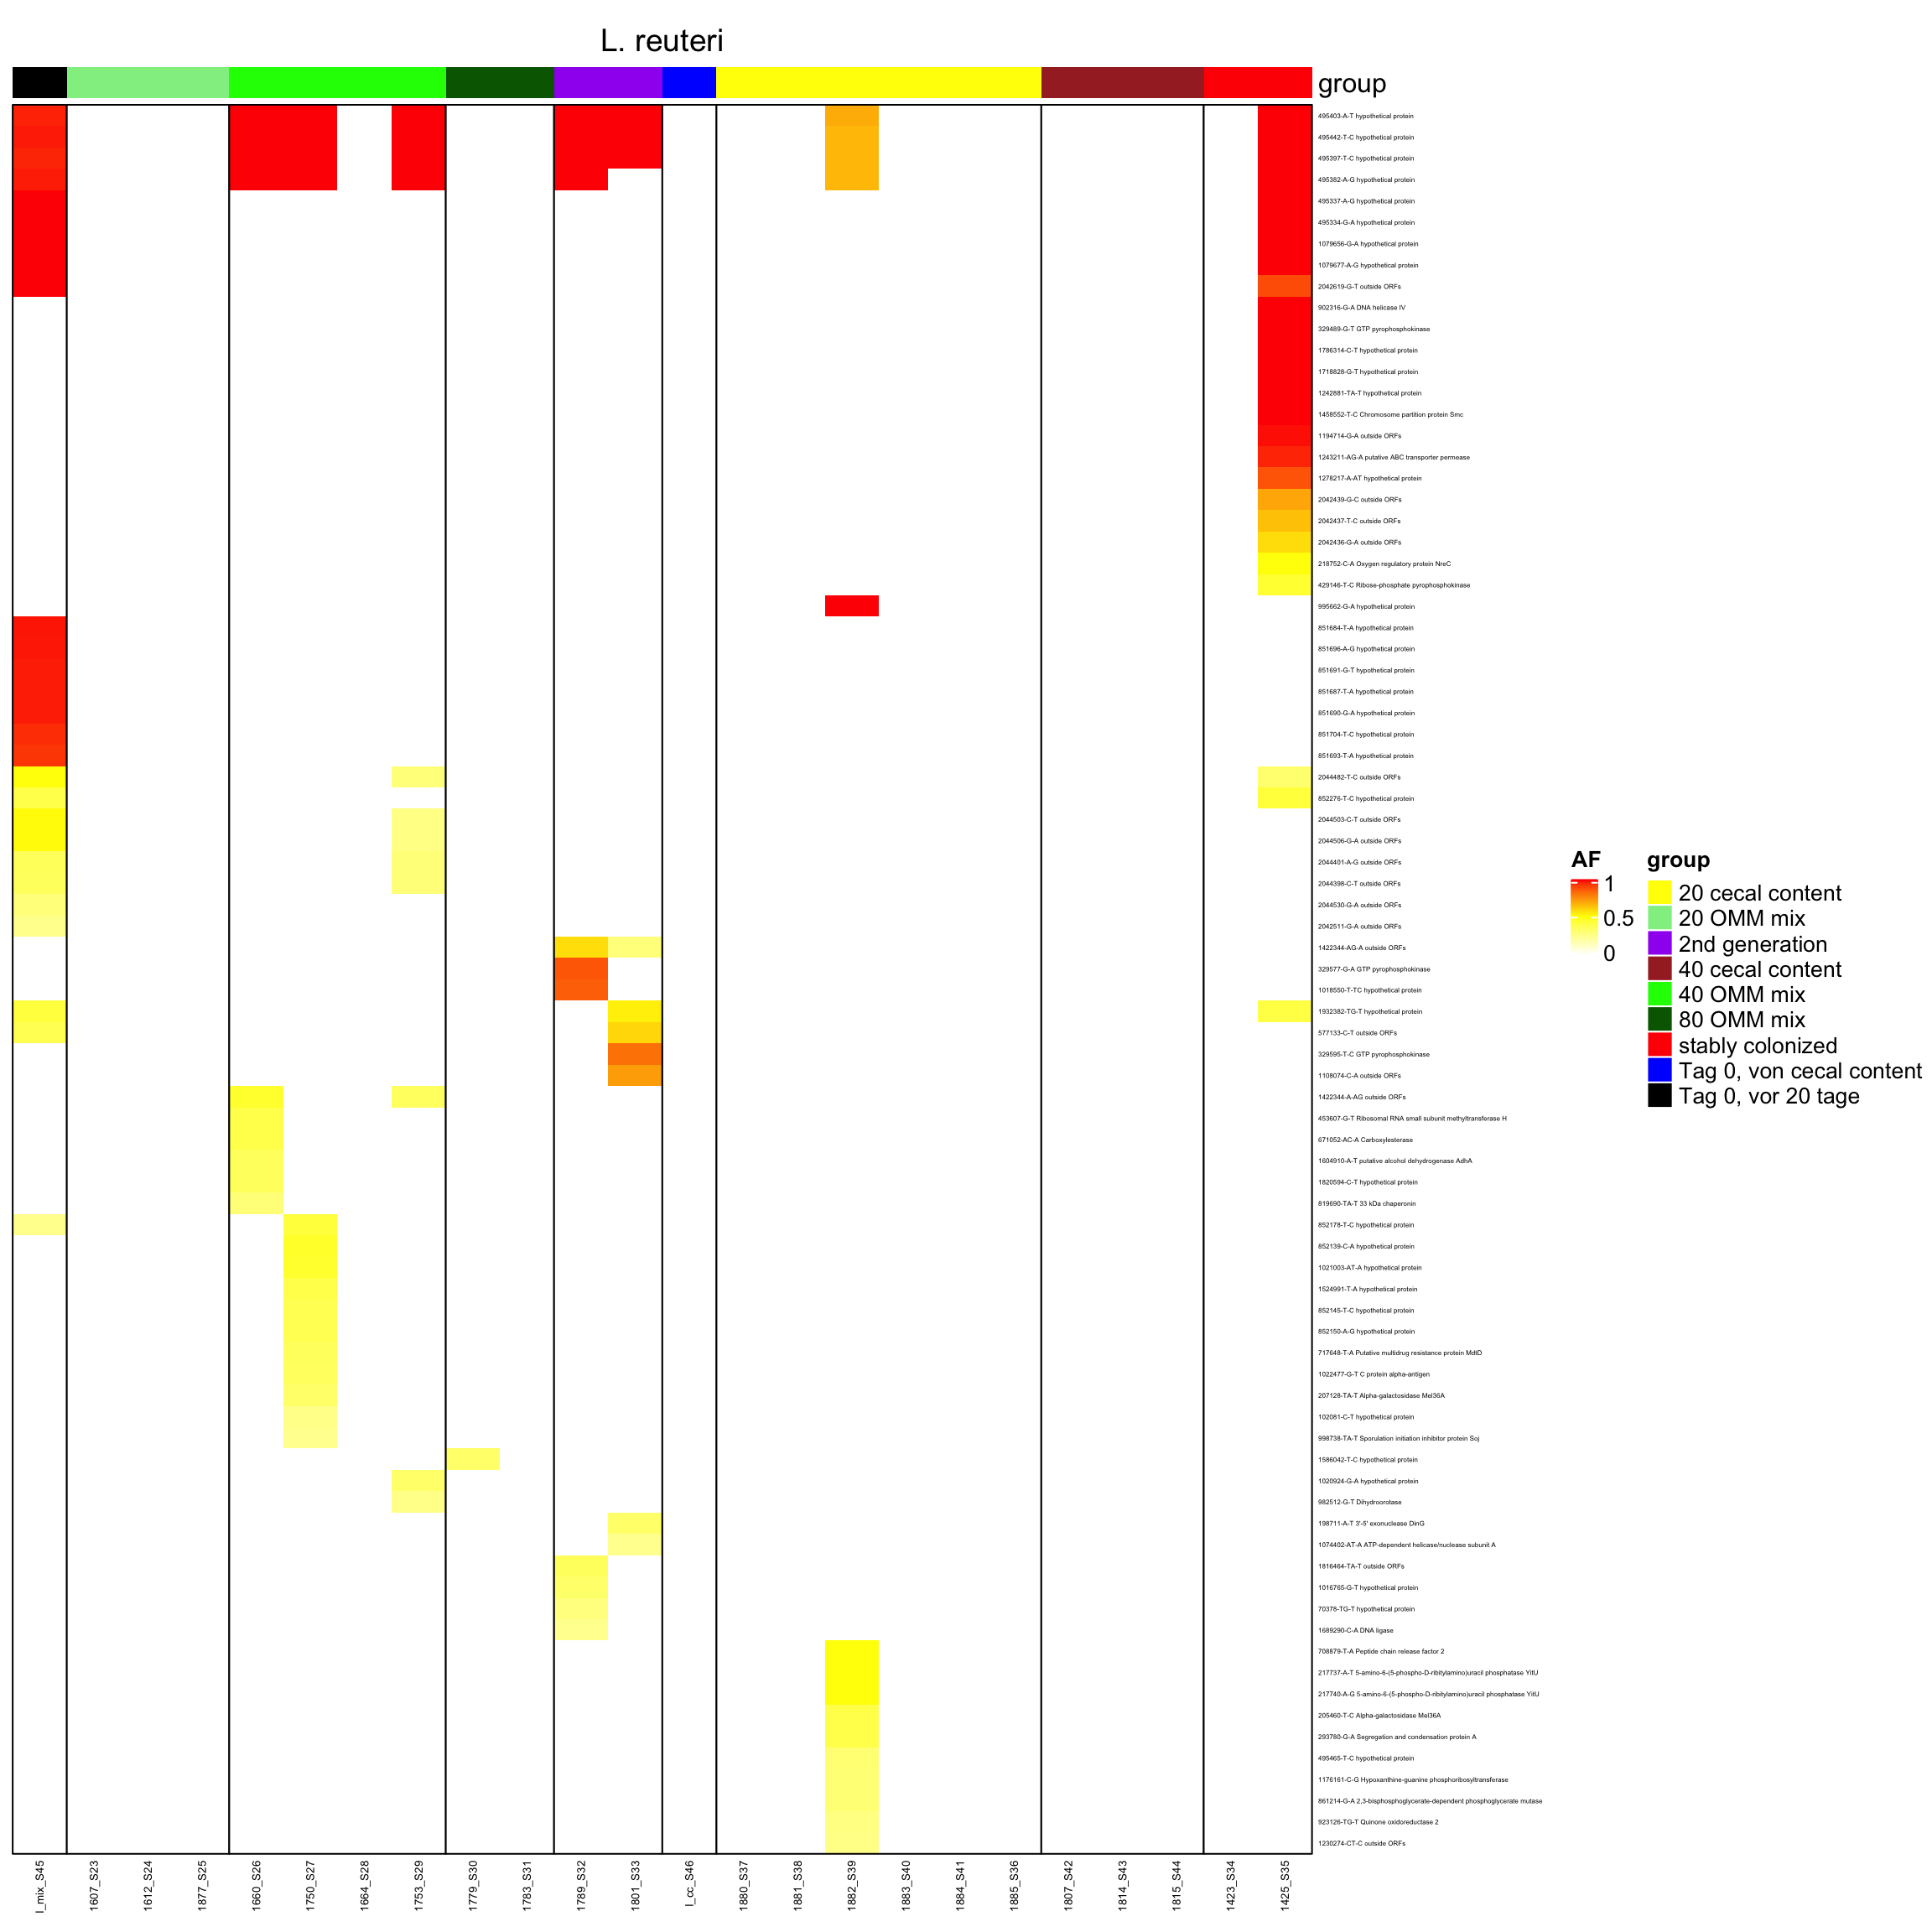
genomeHeat(genome = "L. reuteri", nohyp = T)
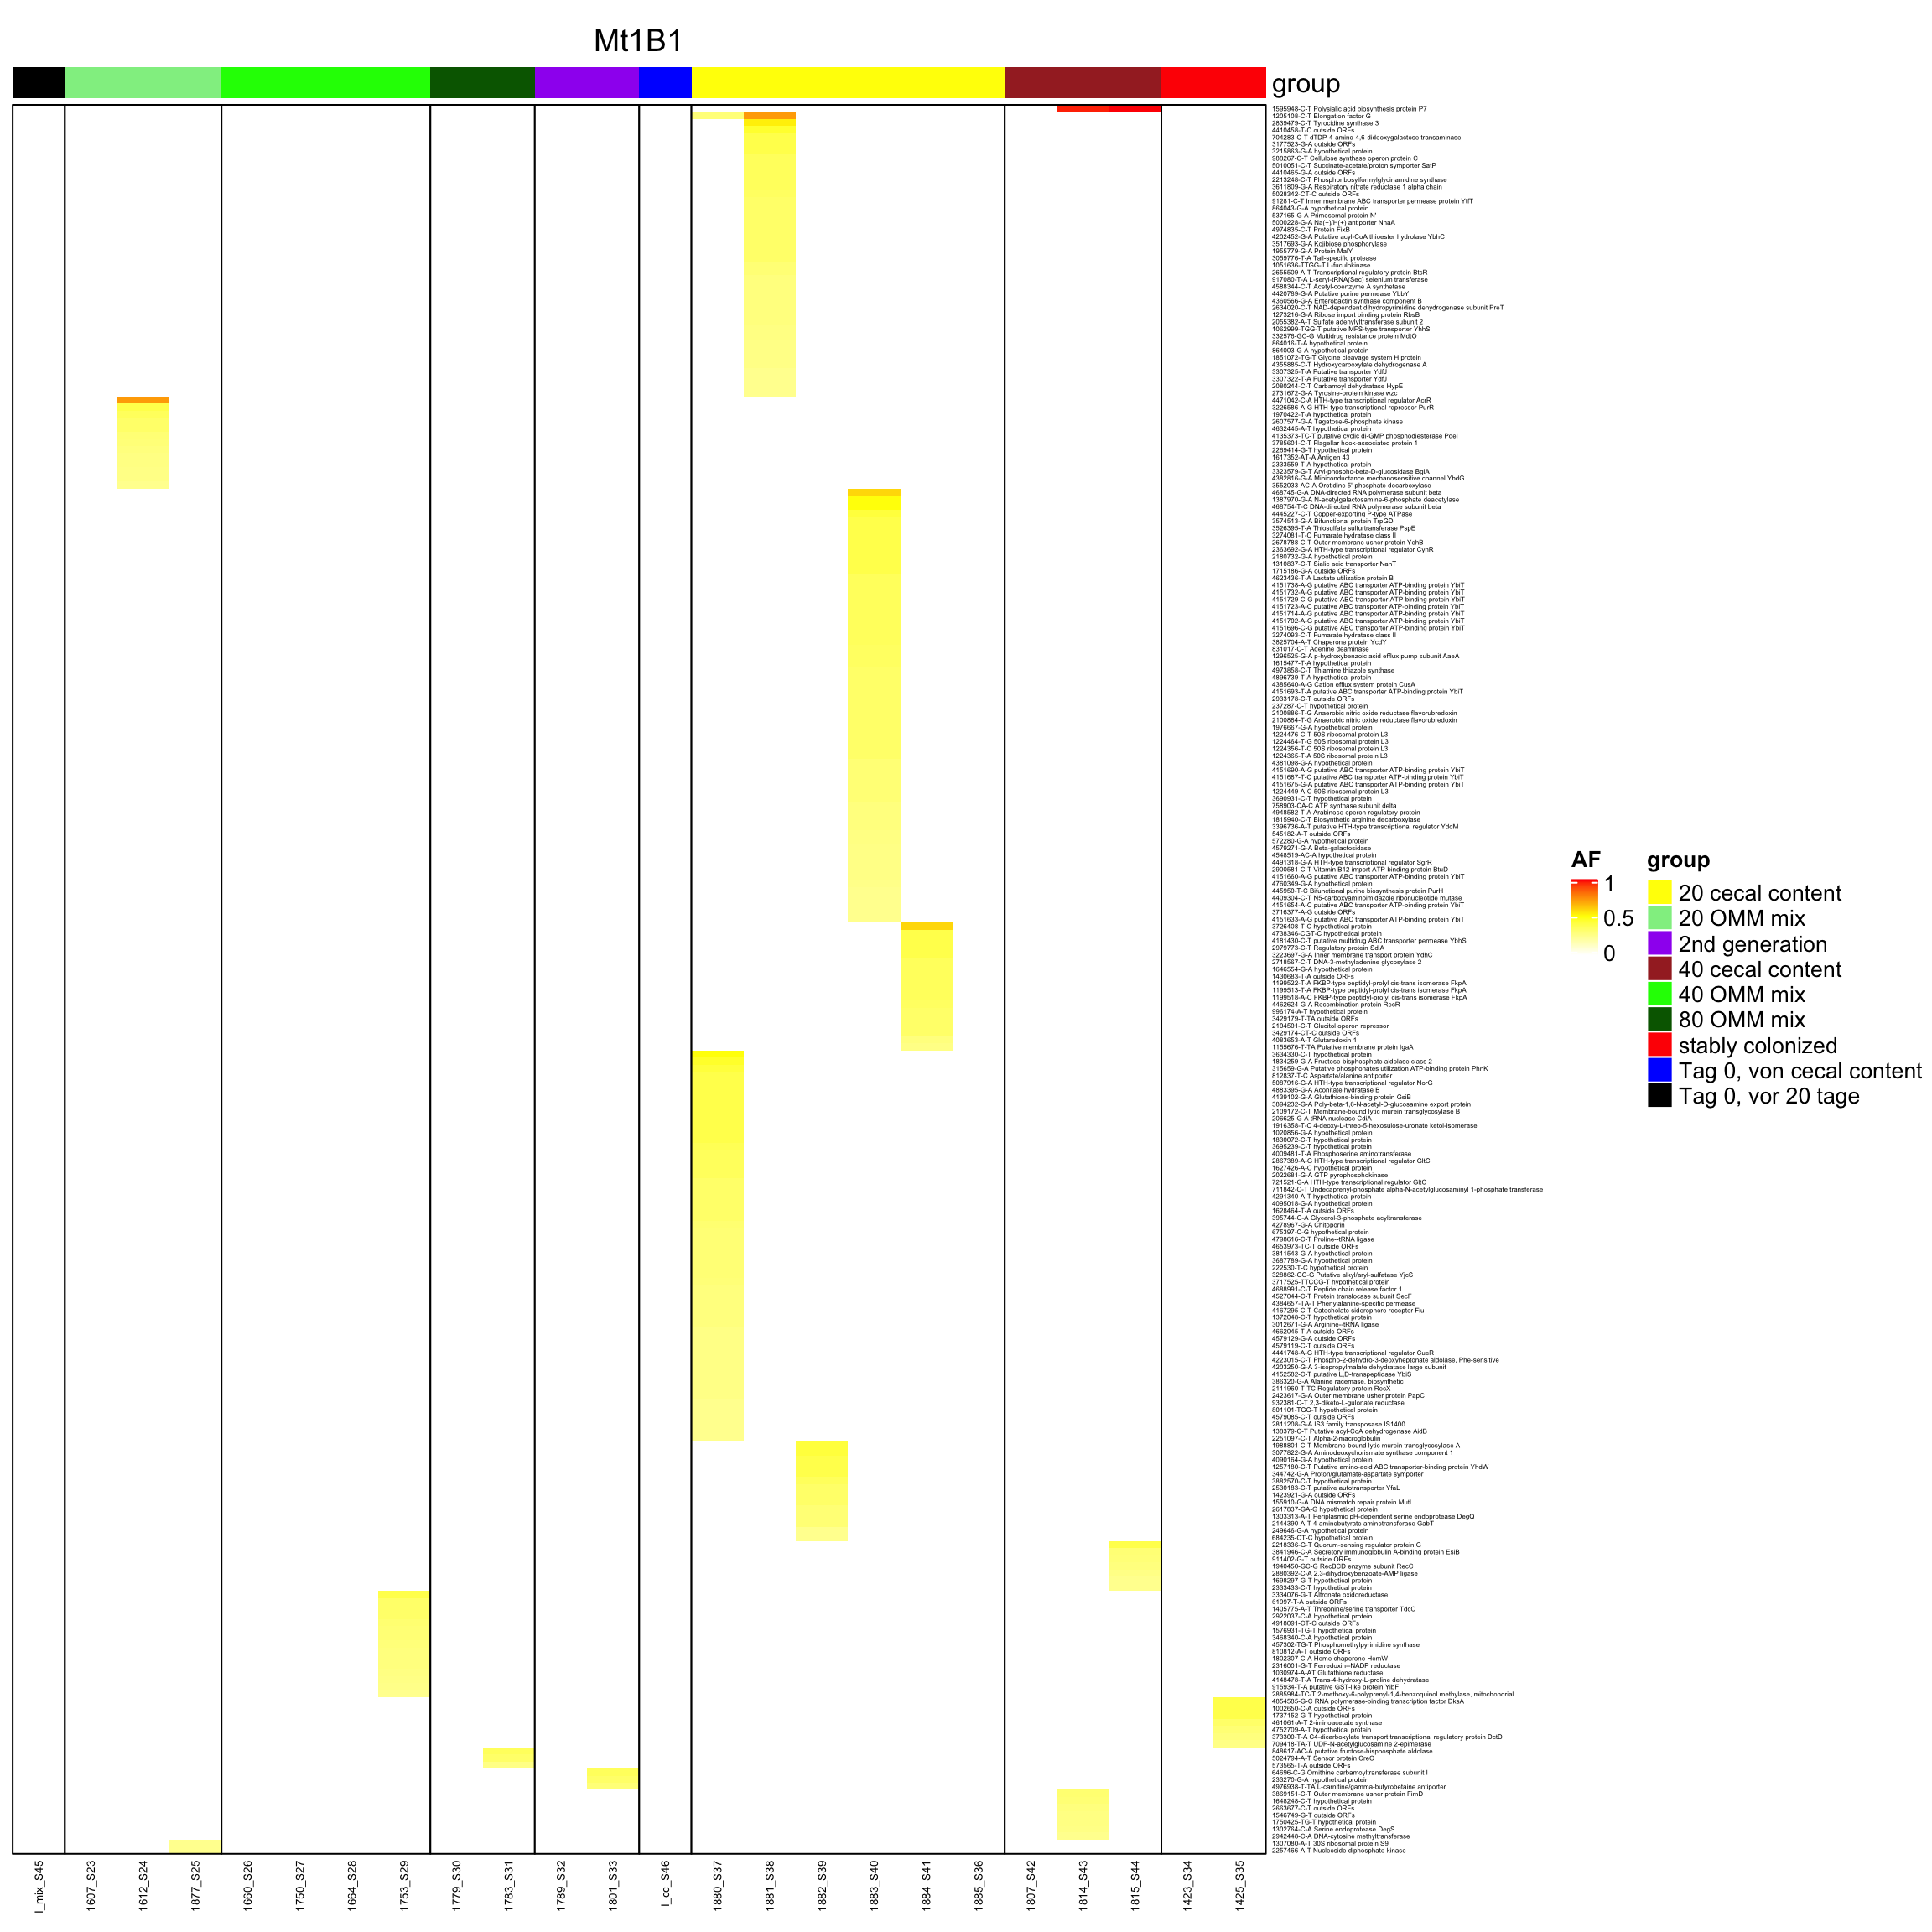
genomeHeat(genome = "Mt1B1", nohyp = T)
genomeHeat(genome = "E. faecalis", nohyp = T)
genomeHeat(genome = "A. muris", nohyp = T)
genomeHeat(genome = "B. longum", nohyp = T)
dev.off()## quartz_off_screen
## 2with hypothetical
pdf("heatmaps_with_hyp.pdf", width = 8, height = 30)
genomeHeat(genome = "A. muciniphila")
genomeHeat(genome = "B. caecimuris")
genomeHeat(genome = "B. coccoides")
genomeHeat(genome = "C. clostridioforme")
genomeHeat(genome = "F. plautii", nohyp = T)
genomeHeat(genome = "M. intestinale")
genomeHeat(genome = "T. muris")
genomeHeat(genome = "C. innocuum")
genomeHeat(genome = "L. reuteri")
genomeHeat(genome = "Mt1B1")
genomeHeat(genome = "E. faecalis")
genomeHeat(genome = "A. muris")
genomeHeat(genome = "B. longum")
dev.off()
## quartz_off_screen
## 22.11 locations of SNP in genome
dat <- readRDS("data/rds/omm_claudia_new_10percent.rds")
p <- ggplot(dat, aes(x = POS, y = AF, color = mouse.group))
p <- p + facet_grid(chr ~ ., scales = "free_x", space = "free", shrink = T)
p <- p + geom_point(size = 0.1, shape = ".", alpha = 0.5) + scale_color_brewer(palette = "Dark2")
p <- p + theme_minimal()
p <- p + theme_minimal()
p <- p + theme(strip.background = element_blank(), strip.text.y = element_text(angle = 0, color = "black"),
    axis.title.y = element_blank(), axis.text.y = element_blank(), axis.ticks.y = element_blank(),
    axis.line.y = element_blank(), panel.border = element_rect(colour = "black", fill = NA,
        size = 0.2), panel.grid.major = element_blank(), panel.grid.minor = element_blank())

p
## Warning in RColorBrewer::brewer.pal(n, pal): n too large, allowed maximum for palette Dark2 is 8
## Returning the palette you asked for with that many colors## Warning: Removed 285 rows containing missing values (geom_point).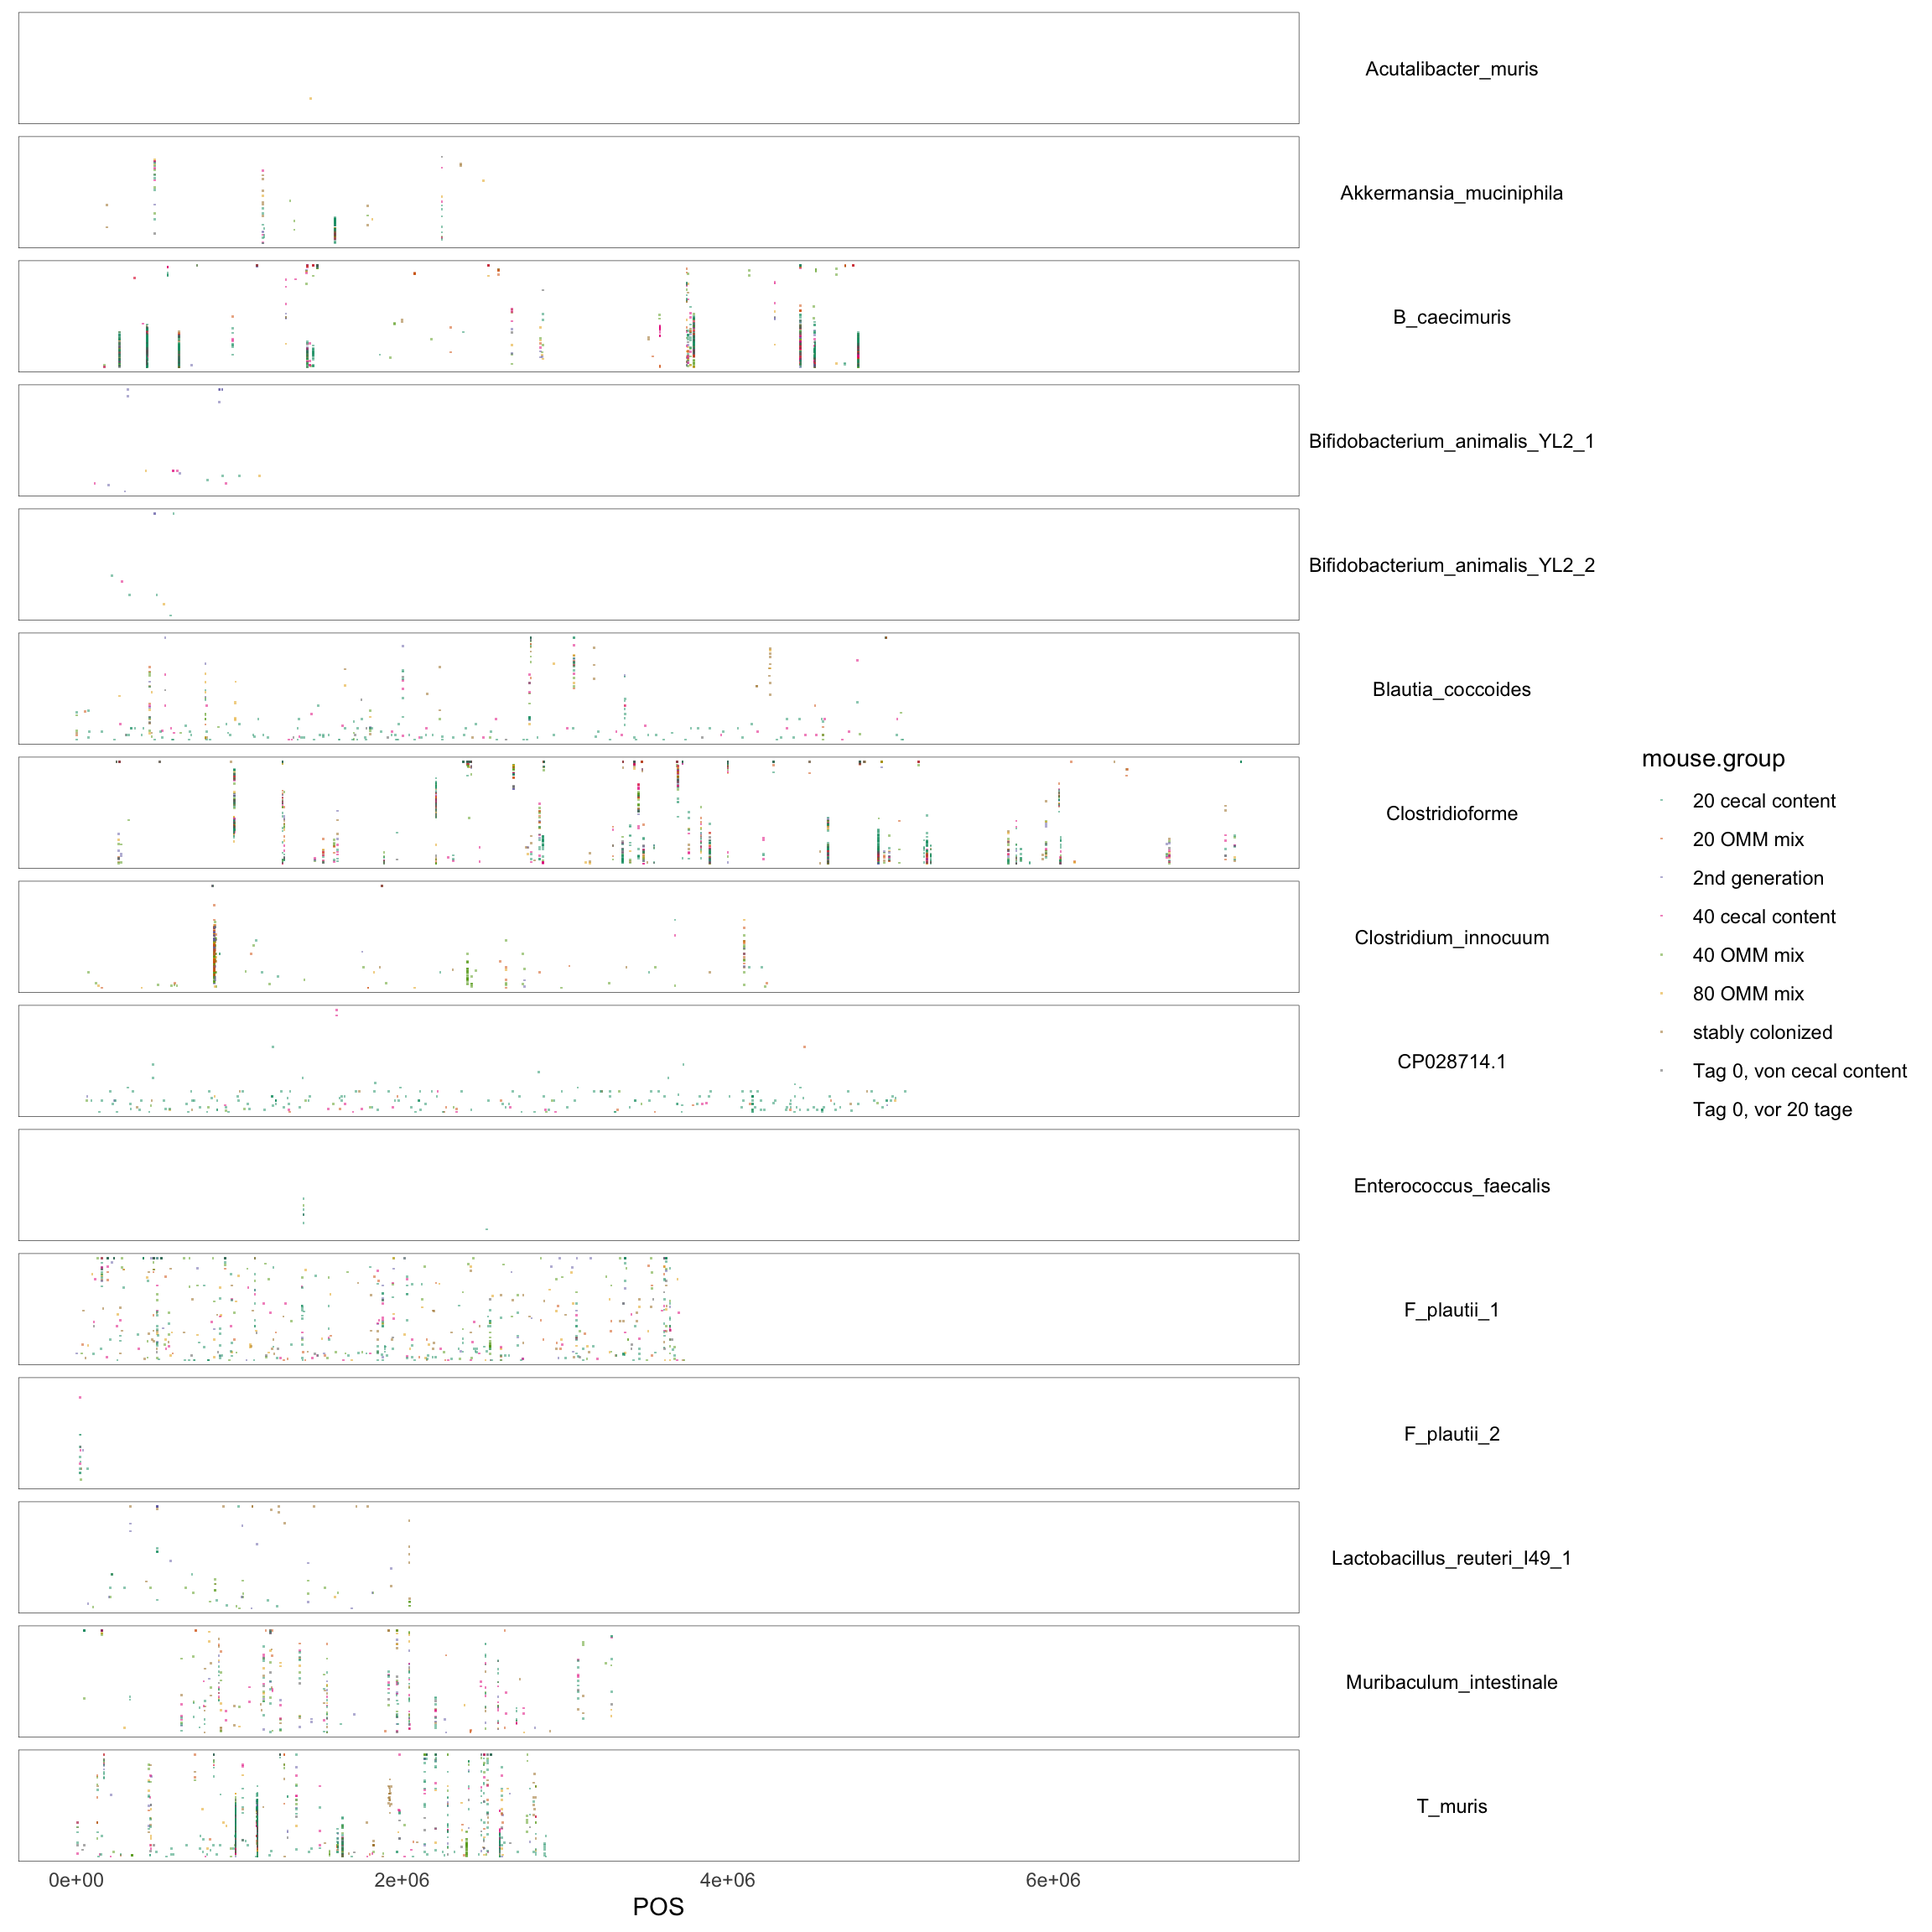
createPositionPlot <- function(chr = "Akkermansia_muciniphila", threshold = 0.3) {
    require("ggrepel")
    library(RColorBrewer)

    shapes = group = c(insertion = "+", deletion = "-", SNP = "x")
    dat <- readRDS("data/rds/omm_claudia_new_10percent.rds")
    dat <- dat[which(dat$chr == chr), ]

    # sum up AF per position to get a measrue of how interesting a location is (e.g. to filter
    # out for which locations we should show a funcitonal annotation)

    nb.cols <- 9
    mycolors <- colorRampPalette(brewer.pal(8, "Set2"))(nb.cols)

    dat_sum <- aggregate(AF ~ POS + feature + alteration_type, dat, sum)
    dat_sum <- dat_sum[which(dat_sum$AF > threshold), ]
    dat_sum$y <- 1
    numb <- nrow(dat_sum)
    dat_sum$AF <- sample(1:9, numb, replace = TRUE)/10
    if (any(dat_sum$feature == "hypothetical protein"))
        dat_sum[which(dat_sum$feature == "hypothetical protein"), ]$feature <- ""
    if (any(dat_sum$feature == "outside ORFs"))
        dat_sum[which(dat_sum$feature == "outside ORFs"), ]$feature <- ""

    dat_sum$type <- ifelse(dat_sum$feature == "", "hypo", "annotated")

    # get the max AF values per position to get the y coordinate for annotation
    dat_max <- aggregate(AF ~ POS + feature + alteration_type, dat, max)
    dat_sum$AF <- dat_max[match(dat_sum$POS, dat_max$POS), ]$AF

    p <- ggplot(dat, aes(x = POS, y = AF, shape = alteration_type, label = feature))
    p <- p + geom_vline(data = dat_sum, aes(xintercept = POS), alpha = 1, color = "grey90")
    p <- p + geom_point(aes(color = mouse.group), size = 2)
    p <- p + scale_color_manual(values = mycolors)
    p <- p + ylim(0, 1)
    p <- p + geom_text_repel(min.segment.length = 0, data = dat_sum, aes(label = feature), size = 2,
        box.padding = unit(0.35, "lines"), point.padding = unit(0.3, "lines"))
    p <- p + theme_minimal()
    p <- p + scale_shape_manual(values = shapes)
    p <- p + theme(strip.background = element_blank(), strip.text.y = element_text(angle = 0,
        color = "black"), axis.title.y = element_blank(), axis.ticks.y = element_blank(), axis.line.y = element_blank(),
        panel.border = element_rect(colour = "black", fill = NA, size = 0.2), panel.grid.major = element_blank(),
        panel.grid.minor = element_blank())
    p <- p + ggtitle(genome)
    return(p)
}
2.11.1 Akkermansia muciniphila
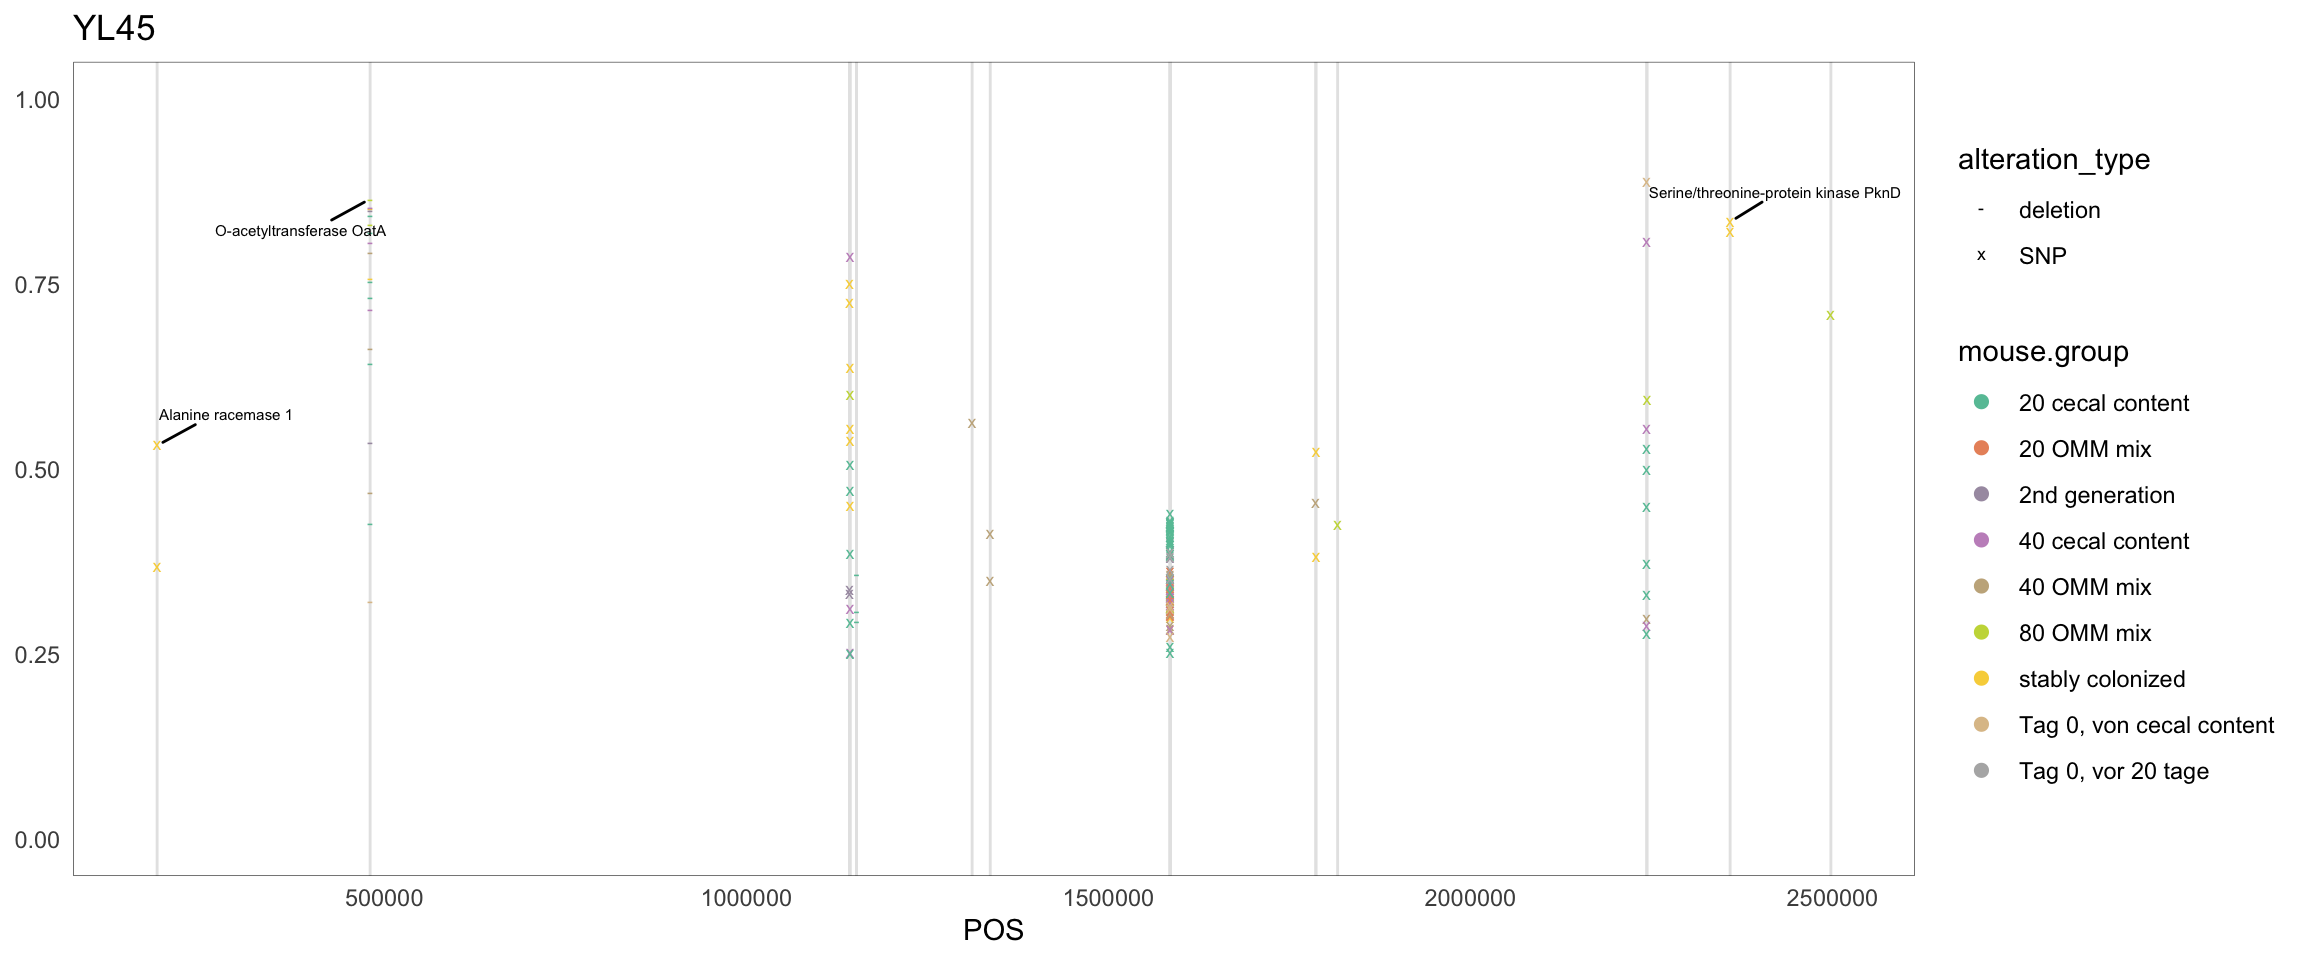
Figure 2.8: Position of variants. vertical lines show positions with functional annotation, if no annotation is shown, then its either hypothetical or outside ORF
## Warning in if (nchar(plot$labels$title %||% "") > 0) {: the condition has length > 1 and
## only the first element will be used
## Warning in geom2trace.default(dots[[1L]][[2L]], dots[[2L]][[1L]], dots[[3L]][[1L]]): geom_GeomTextRepel() has yet to be implemented in plotly.
## If you'd like to see this geom implemented,
## Please open an issue with your example code at
## https://github.com/ropensci/plotly/issues
## Warning in geom2trace.default(dots[[1L]][[2L]], dots[[2L]][[1L]], dots[[3L]][[1L]]): geom_GeomTextRepel() has yet to be implemented in plotly.
## If you'd like to see this geom implemented,
## Please open an issue with your example code at
## https://github.com/ropensci/plotly/issuesFigure 2.9: Position of variants
2.11.2 B_caecimuris
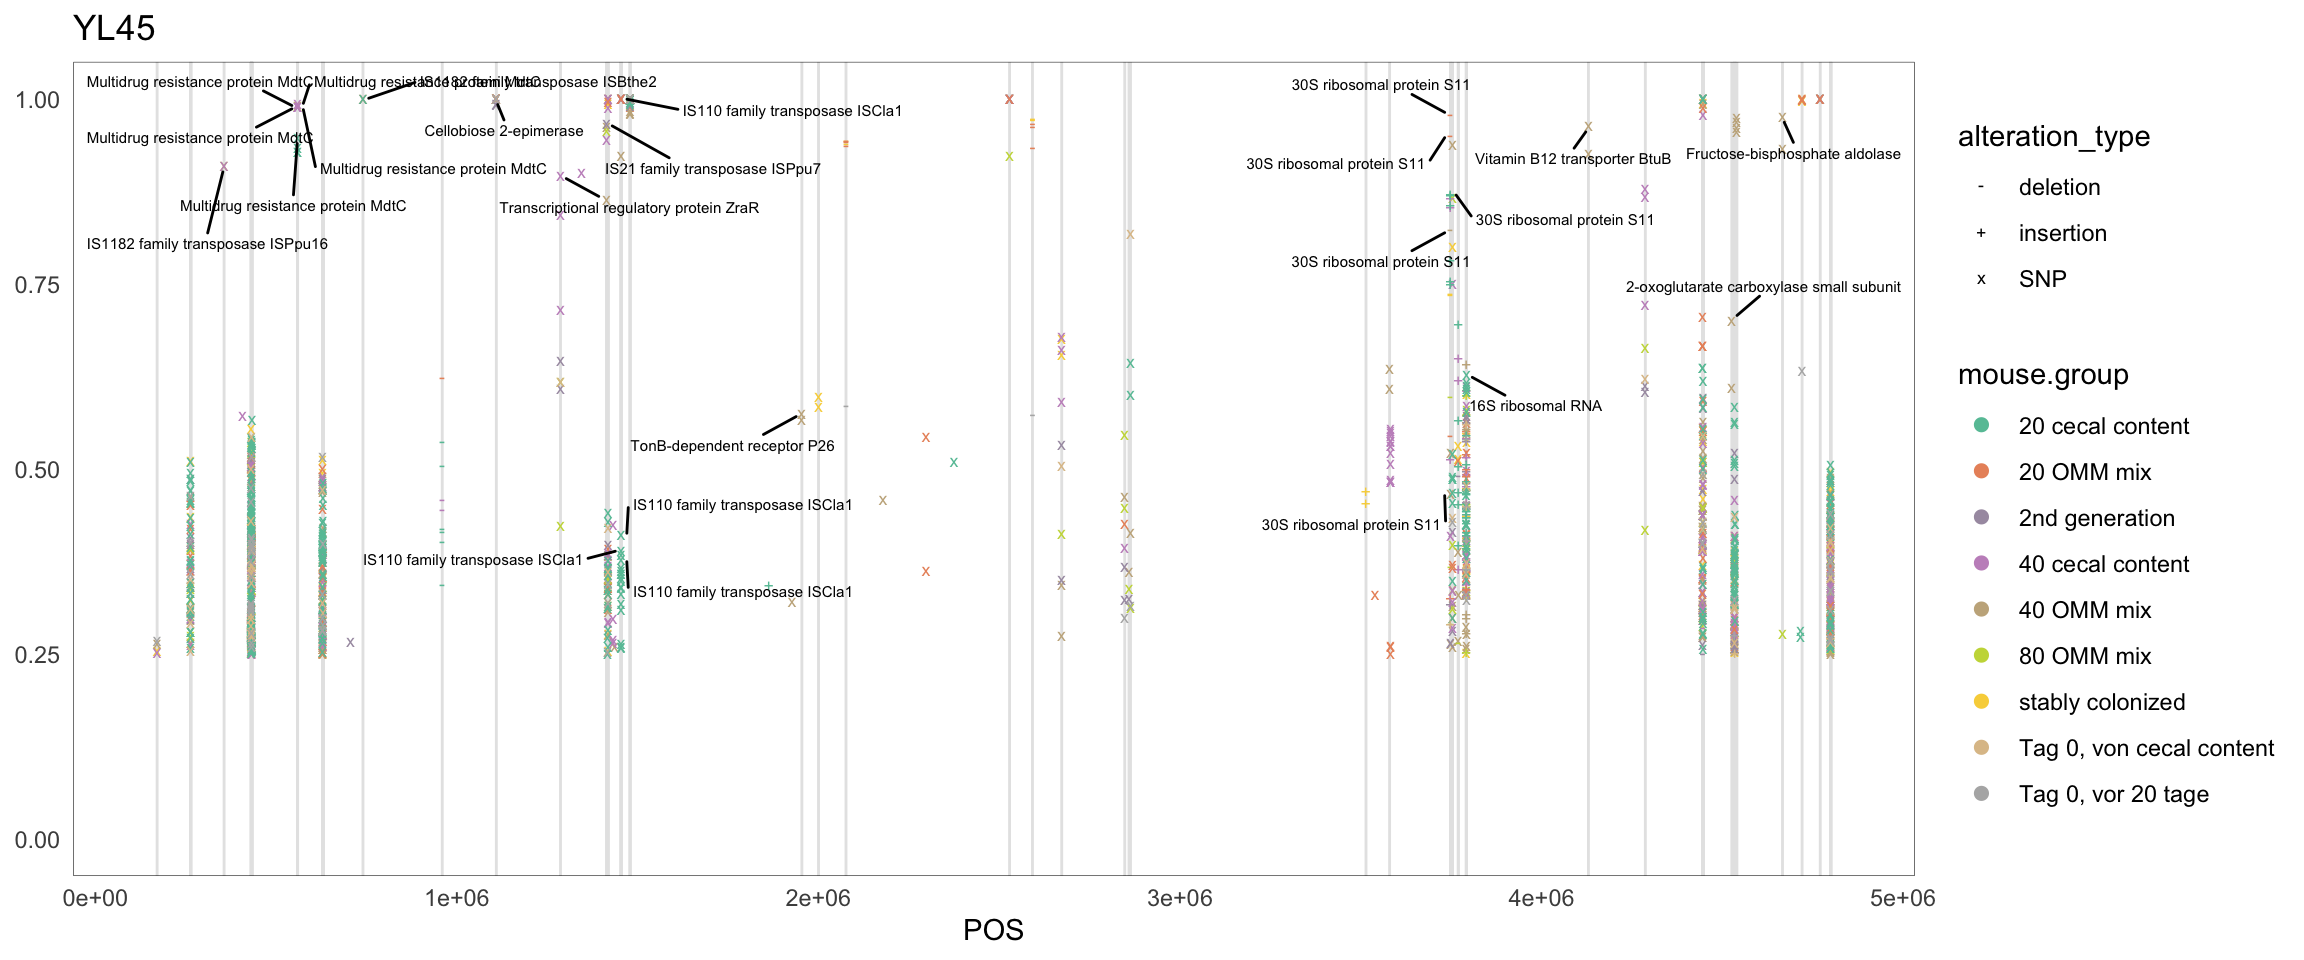
Figure 2.10: Position of variants. vertical lines show positions with functional annotation, if no annotation is shown, then its either hypothetical or outside ORF
## Warning in if (nchar(plot$labels$title %||% "") > 0) {: the condition has length > 1 and
## only the first element will be used
## Warning in geom2trace.default(dots[[1L]][[3L]], dots[[2L]][[1L]], dots[[3L]][[1L]]): geom_GeomTextRepel() has yet to be implemented in plotly.
## If you'd like to see this geom implemented,
## Please open an issue with your example code at
## https://github.com/ropensci/plotly/issues
## Warning in geom2trace.default(dots[[1L]][[3L]], dots[[2L]][[1L]], dots[[3L]][[1L]]): geom_GeomTextRepel() has yet to be implemented in plotly.
## If you'd like to see this geom implemented,
## Please open an issue with your example code at
## https://github.com/ropensci/plotly/issues
## Warning in geom2trace.default(dots[[1L]][[3L]], dots[[2L]][[1L]], dots[[3L]][[1L]]): geom_GeomTextRepel() has yet to be implemented in plotly.
## If you'd like to see this geom implemented,
## Please open an issue with your example code at
## https://github.com/ropensci/plotly/issuesFigure 2.11: Position of variants
2.11.3 Blautia_coccoides
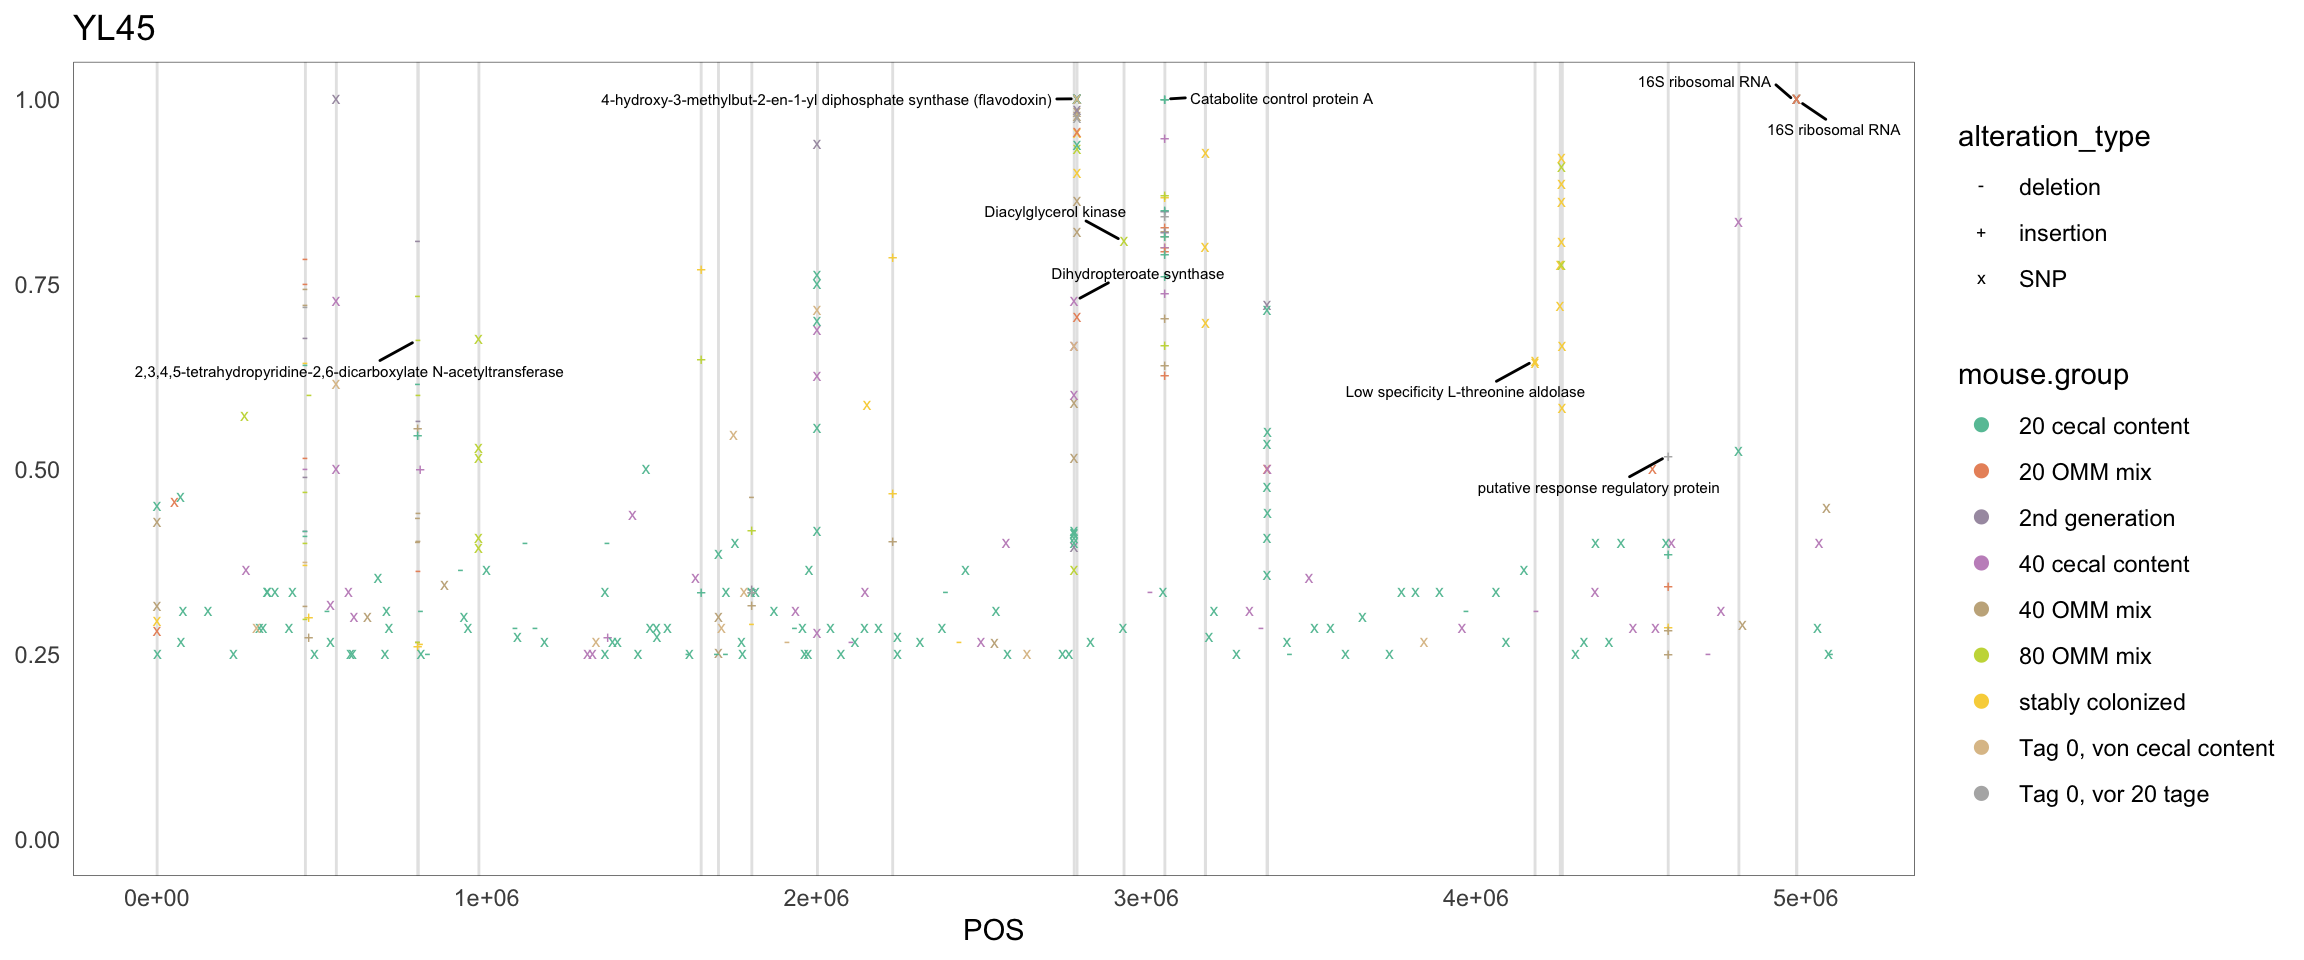
Figure 2.12: Position of variants. vertical lines show positions with functional annotation, if no annotation is shown, then its either hypothetical or outside ORF
## Warning in if (nchar(plot$labels$title %||% "") > 0) {: the condition has length > 1 and
## only the first element will be used
## Warning in geom2trace.default(dots[[1L]][[3L]], dots[[2L]][[1L]], dots[[3L]][[1L]]): geom_GeomTextRepel() has yet to be implemented in plotly.
## If you'd like to see this geom implemented,
## Please open an issue with your example code at
## https://github.com/ropensci/plotly/issues
## Warning in geom2trace.default(dots[[1L]][[3L]], dots[[2L]][[1L]], dots[[3L]][[1L]]): geom_GeomTextRepel() has yet to be implemented in plotly.
## If you'd like to see this geom implemented,
## Please open an issue with your example code at
## https://github.com/ropensci/plotly/issues
## Warning in geom2trace.default(dots[[1L]][[3L]], dots[[2L]][[1L]], dots[[3L]][[1L]]): geom_GeomTextRepel() has yet to be implemented in plotly.
## If you'd like to see this geom implemented,
## Please open an issue with your example code at
## https://github.com/ropensci/plotly/issuesFigure 2.13: Position of variants
2.11.4 Clostridioforme
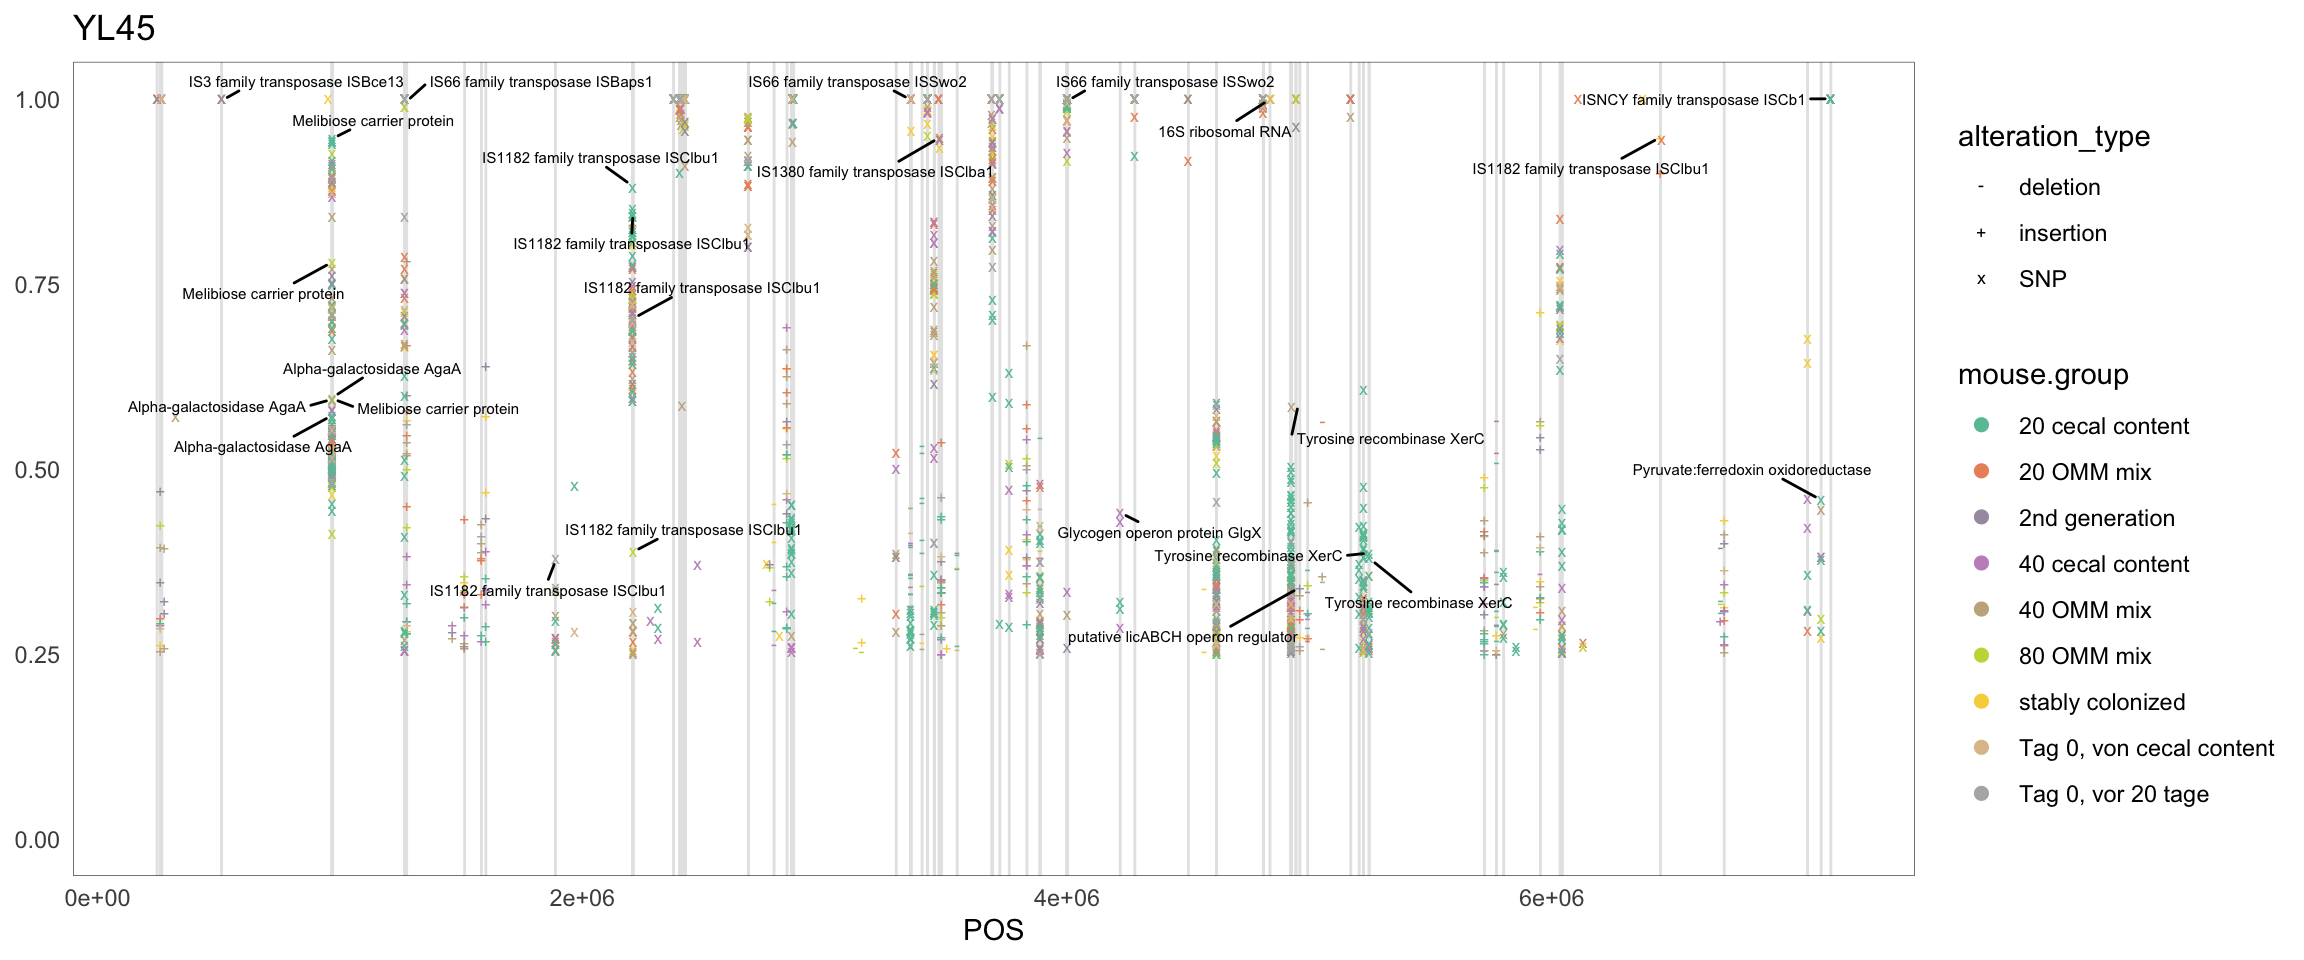
Figure 2.14: Position of variants. vertical lines show positions with functional annotation, if no annotation is shown, then its either hypothetical or outside ORF
## Warning in if (nchar(plot$labels$title %||% "") > 0) {: the condition has length > 1 and
## only the first element will be used
## Warning in geom2trace.default(dots[[1L]][[3L]], dots[[2L]][[1L]], dots[[3L]][[1L]]): geom_GeomTextRepel() has yet to be implemented in plotly.
## If you'd like to see this geom implemented,
## Please open an issue with your example code at
## https://github.com/ropensci/plotly/issues
## Warning in geom2trace.default(dots[[1L]][[3L]], dots[[2L]][[1L]], dots[[3L]][[1L]]): geom_GeomTextRepel() has yet to be implemented in plotly.
## If you'd like to see this geom implemented,
## Please open an issue with your example code at
## https://github.com/ropensci/plotly/issues
## Warning in geom2trace.default(dots[[1L]][[3L]], dots[[2L]][[1L]], dots[[3L]][[1L]]): geom_GeomTextRepel() has yet to be implemented in plotly.
## If you'd like to see this geom implemented,
## Please open an issue with your example code at
## https://github.com/ropensci/plotly/issuesFigure 2.15: Position of variants
2.11.5 F_plautii_1
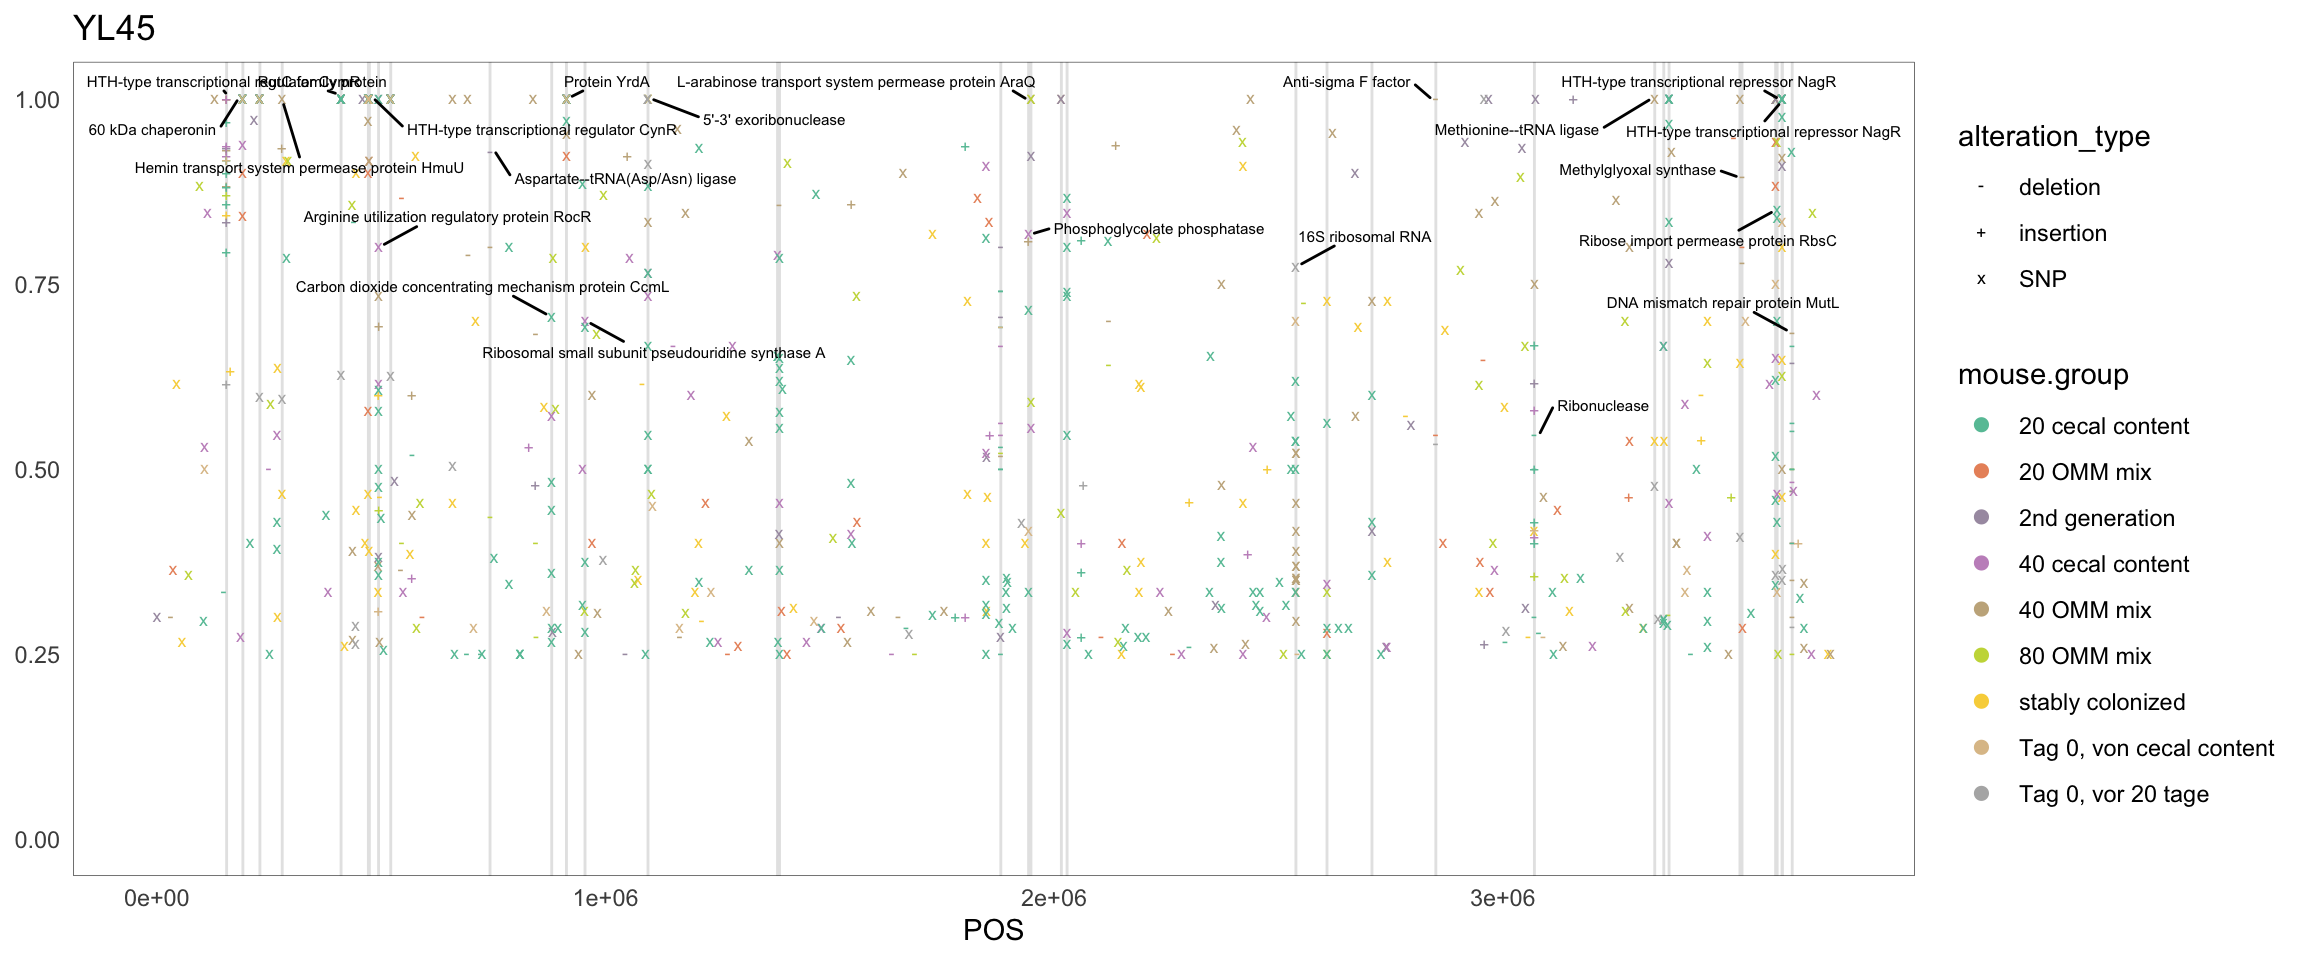
Figure 2.16: Position of variants. vertical lines show positions with functional annotation, if no annotation is shown, then its either hypothetical or outside ORF
## Warning in if (nchar(plot$labels$title %||% "") > 0) {: the condition has length > 1 and
## only the first element will be used
## Warning in geom2trace.default(dots[[1L]][[3L]], dots[[2L]][[1L]], dots[[3L]][[1L]]): geom_GeomTextRepel() has yet to be implemented in plotly.
## If you'd like to see this geom implemented,
## Please open an issue with your example code at
## https://github.com/ropensci/plotly/issues
## Warning in geom2trace.default(dots[[1L]][[3L]], dots[[2L]][[1L]], dots[[3L]][[1L]]): geom_GeomTextRepel() has yet to be implemented in plotly.
## If you'd like to see this geom implemented,
## Please open an issue with your example code at
## https://github.com/ropensci/plotly/issues
## Warning in geom2trace.default(dots[[1L]][[3L]], dots[[2L]][[1L]], dots[[3L]][[1L]]): geom_GeomTextRepel() has yet to be implemented in plotly.
## If you'd like to see this geom implemented,
## Please open an issue with your example code at
## https://github.com/ropensci/plotly/issuesFigure 2.17: Position of variants
2.11.6 Muribaculum_intestinale
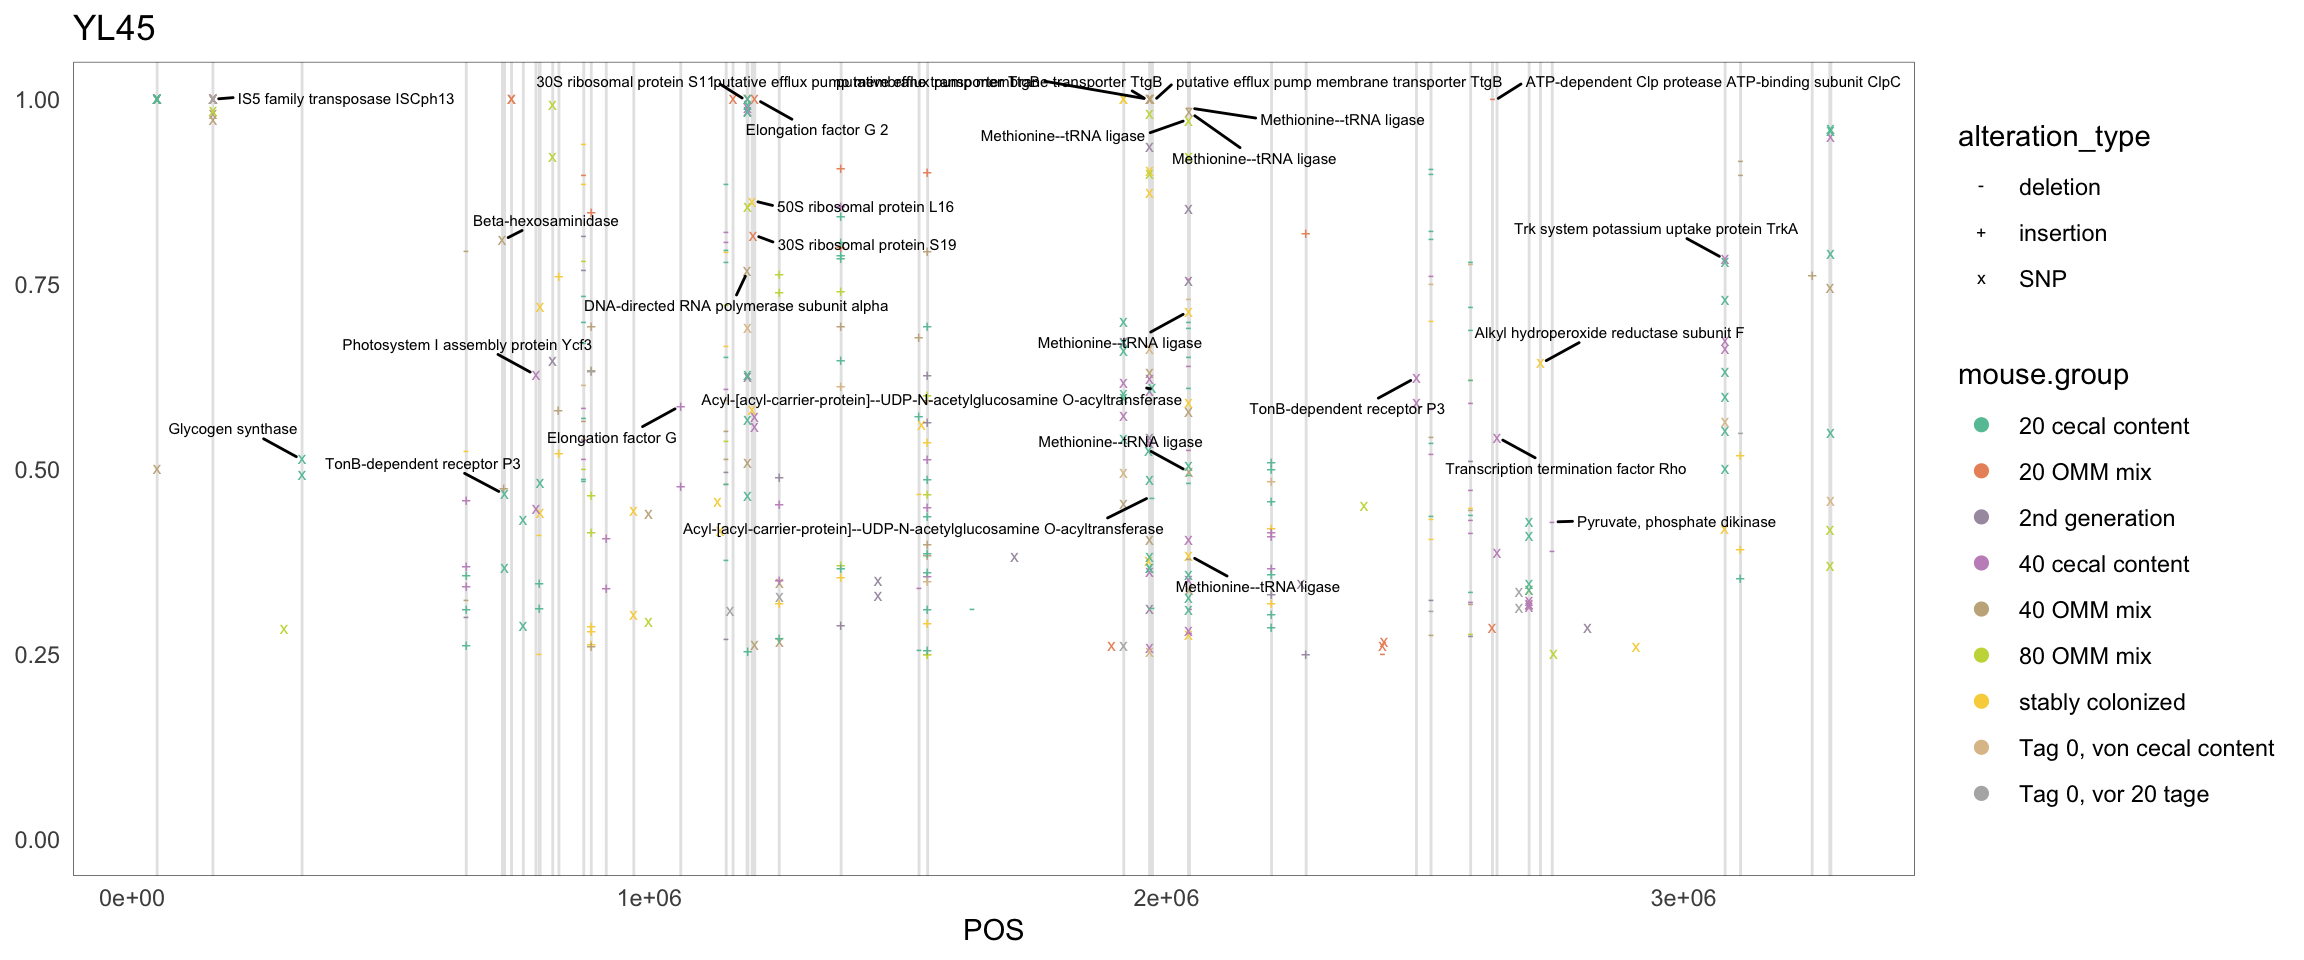
Figure 2.18: Position of variants. vertical lines show positions with functional annotation, if no annotation is shown, then its either hypothetical or outside ORF
## Warning in if (nchar(plot$labels$title %||% "") > 0) {: the condition has length > 1 and
## only the first element will be used
## Warning in geom2trace.default(dots[[1L]][[3L]], dots[[2L]][[1L]], dots[[3L]][[1L]]): geom_GeomTextRepel() has yet to be implemented in plotly.
## If you'd like to see this geom implemented,
## Please open an issue with your example code at
## https://github.com/ropensci/plotly/issues
## Warning in geom2trace.default(dots[[1L]][[3L]], dots[[2L]][[1L]], dots[[3L]][[1L]]): geom_GeomTextRepel() has yet to be implemented in plotly.
## If you'd like to see this geom implemented,
## Please open an issue with your example code at
## https://github.com/ropensci/plotly/issues
## Warning in geom2trace.default(dots[[1L]][[3L]], dots[[2L]][[1L]], dots[[3L]][[1L]]): geom_GeomTextRepel() has yet to be implemented in plotly.
## If you'd like to see this geom implemented,
## Please open an issue with your example code at
## https://github.com/ropensci/plotly/issuesFigure 2.19: Position of variants
2.11.7 T_muris
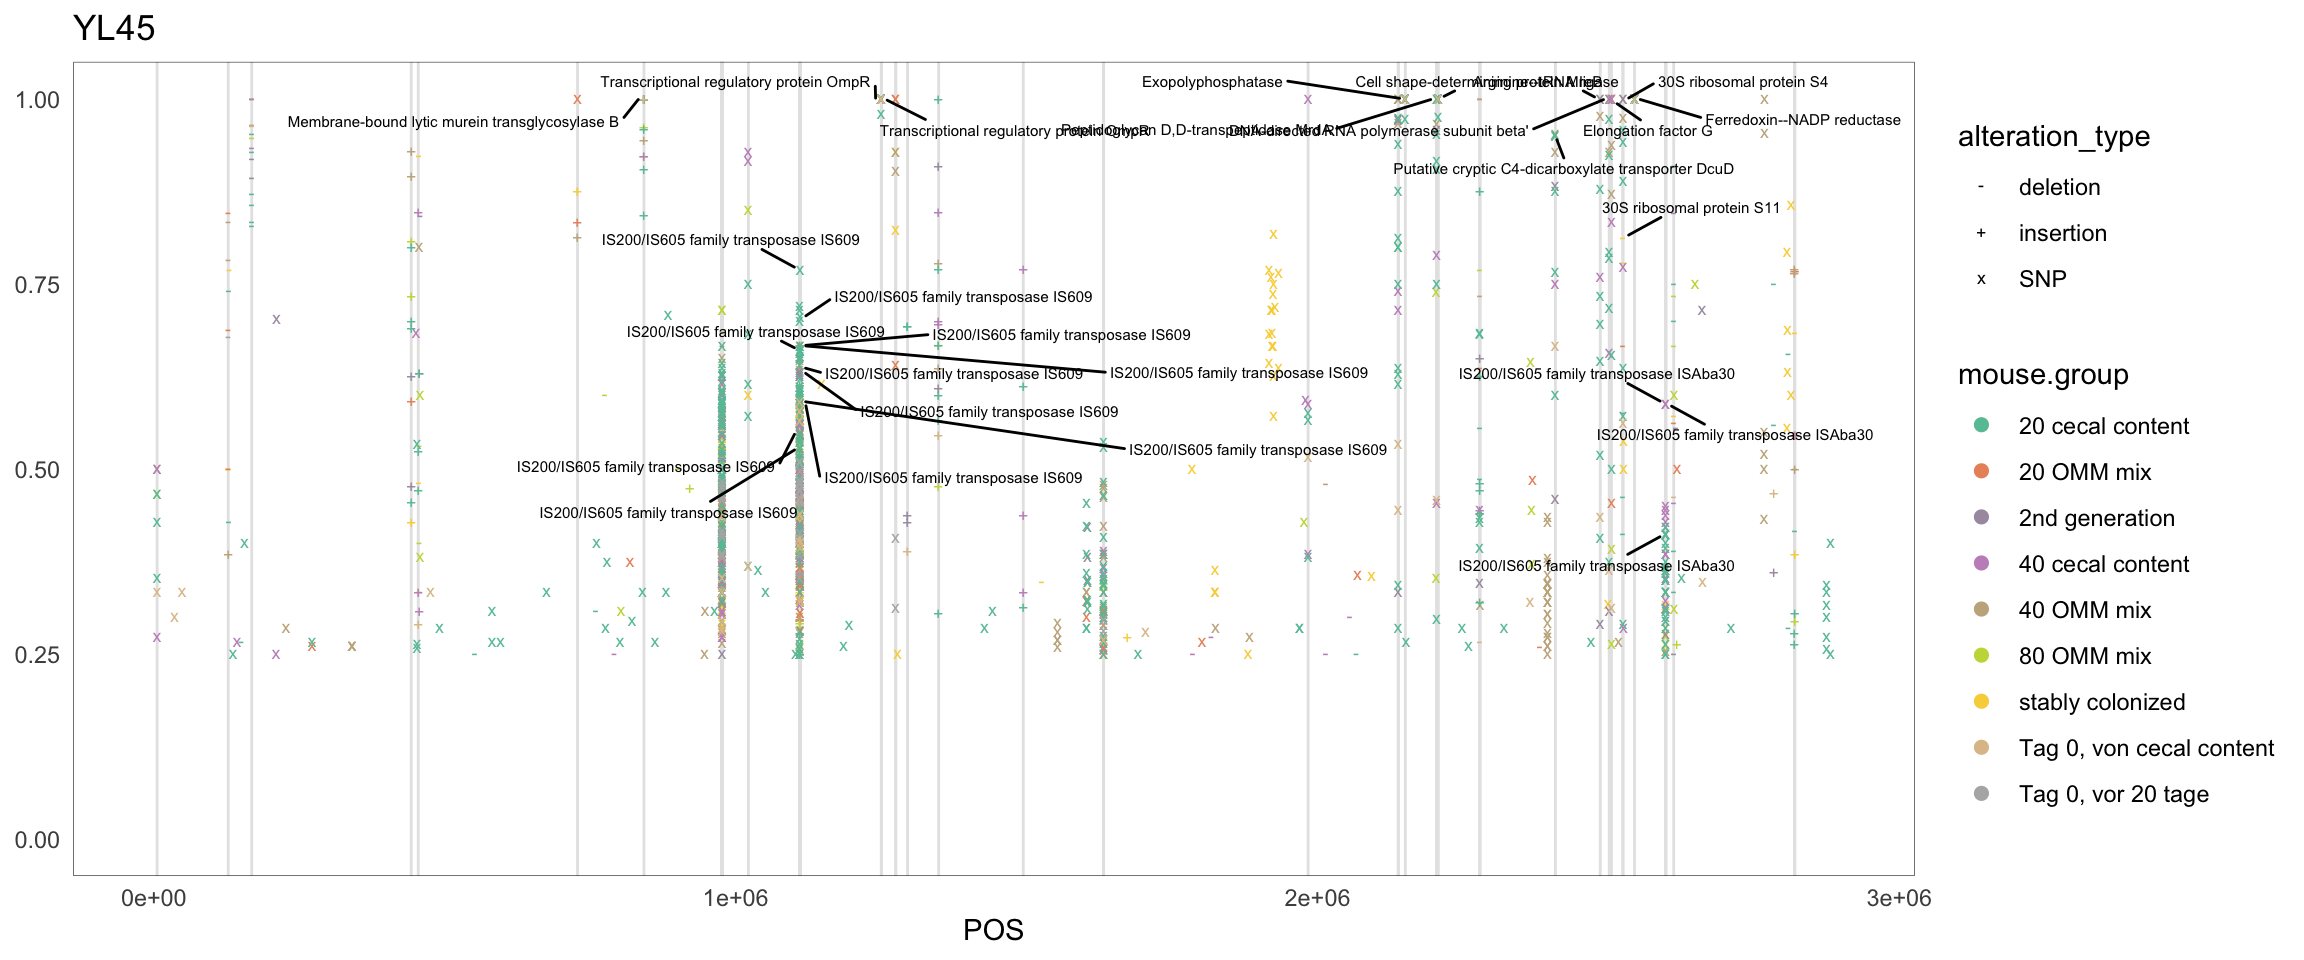
Figure 2.20: Position of variants. vertical lines show positions with functional annotation, if no annotation is shown, then its either hypothetical or outside ORF
## Warning in if (nchar(plot$labels$title %||% "") > 0) {: the condition has length > 1 and
## only the first element will be used
## Warning in geom2trace.default(dots[[1L]][[3L]], dots[[2L]][[1L]], dots[[3L]][[1L]]): geom_GeomTextRepel() has yet to be implemented in plotly.
## If you'd like to see this geom implemented,
## Please open an issue with your example code at
## https://github.com/ropensci/plotly/issues
## Warning in geom2trace.default(dots[[1L]][[3L]], dots[[2L]][[1L]], dots[[3L]][[1L]]): geom_GeomTextRepel() has yet to be implemented in plotly.
## If you'd like to see this geom implemented,
## Please open an issue with your example code at
## https://github.com/ropensci/plotly/issues
## Warning in geom2trace.default(dots[[1L]][[3L]], dots[[2L]][[1L]], dots[[3L]][[1L]]): geom_GeomTextRepel() has yet to be implemented in plotly.
## If you'd like to see this geom implemented,
## Please open an issue with your example code at
## https://github.com/ropensci/plotly/issuesFigure 2.21: Position of variants
2.11.8 Clostridium_innocuum
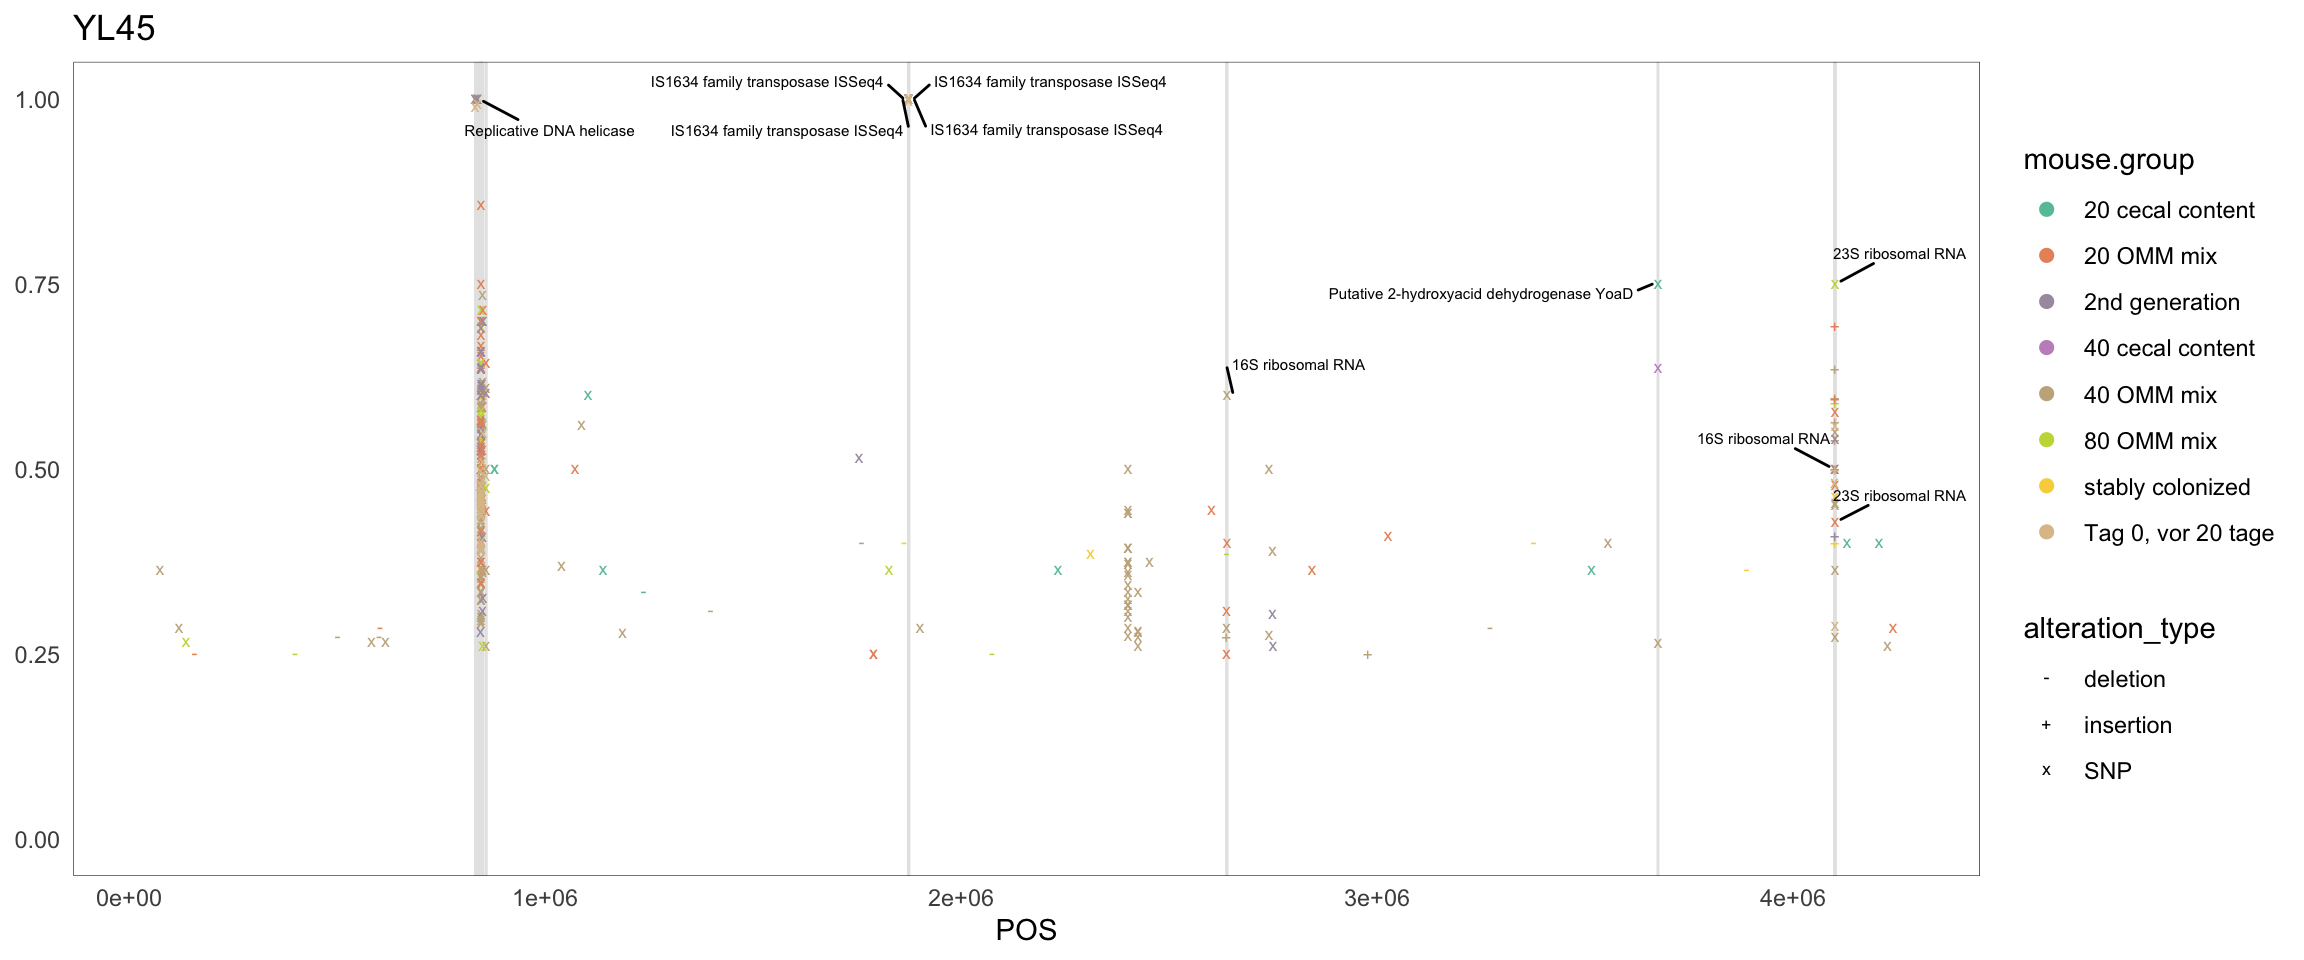
Figure 2.22: Position of variants. vertical lines show positions with functional annotation, if no annotation is shown, then its either hypothetical or outside ORF
## Warning in if (nchar(plot$labels$title %||% "") > 0) {: the condition has length > 1 and
## only the first element will be used
## Warning in geom2trace.default(dots[[1L]][[3L]], dots[[2L]][[1L]], dots[[3L]][[1L]]): geom_GeomTextRepel() has yet to be implemented in plotly.
## If you'd like to see this geom implemented,
## Please open an issue with your example code at
## https://github.com/ropensci/plotly/issues
## Warning in geom2trace.default(dots[[1L]][[3L]], dots[[2L]][[1L]], dots[[3L]][[1L]]): geom_GeomTextRepel() has yet to be implemented in plotly.
## If you'd like to see this geom implemented,
## Please open an issue with your example code at
## https://github.com/ropensci/plotly/issues
## Warning in geom2trace.default(dots[[1L]][[3L]], dots[[2L]][[1L]], dots[[3L]][[1L]]): geom_GeomTextRepel() has yet to be implemented in plotly.
## If you'd like to see this geom implemented,
## Please open an issue with your example code at
## https://github.com/ropensci/plotly/issuesFigure 2.23: Position of variants
2.11.9 Lactobacillus_reuteri_I49_1
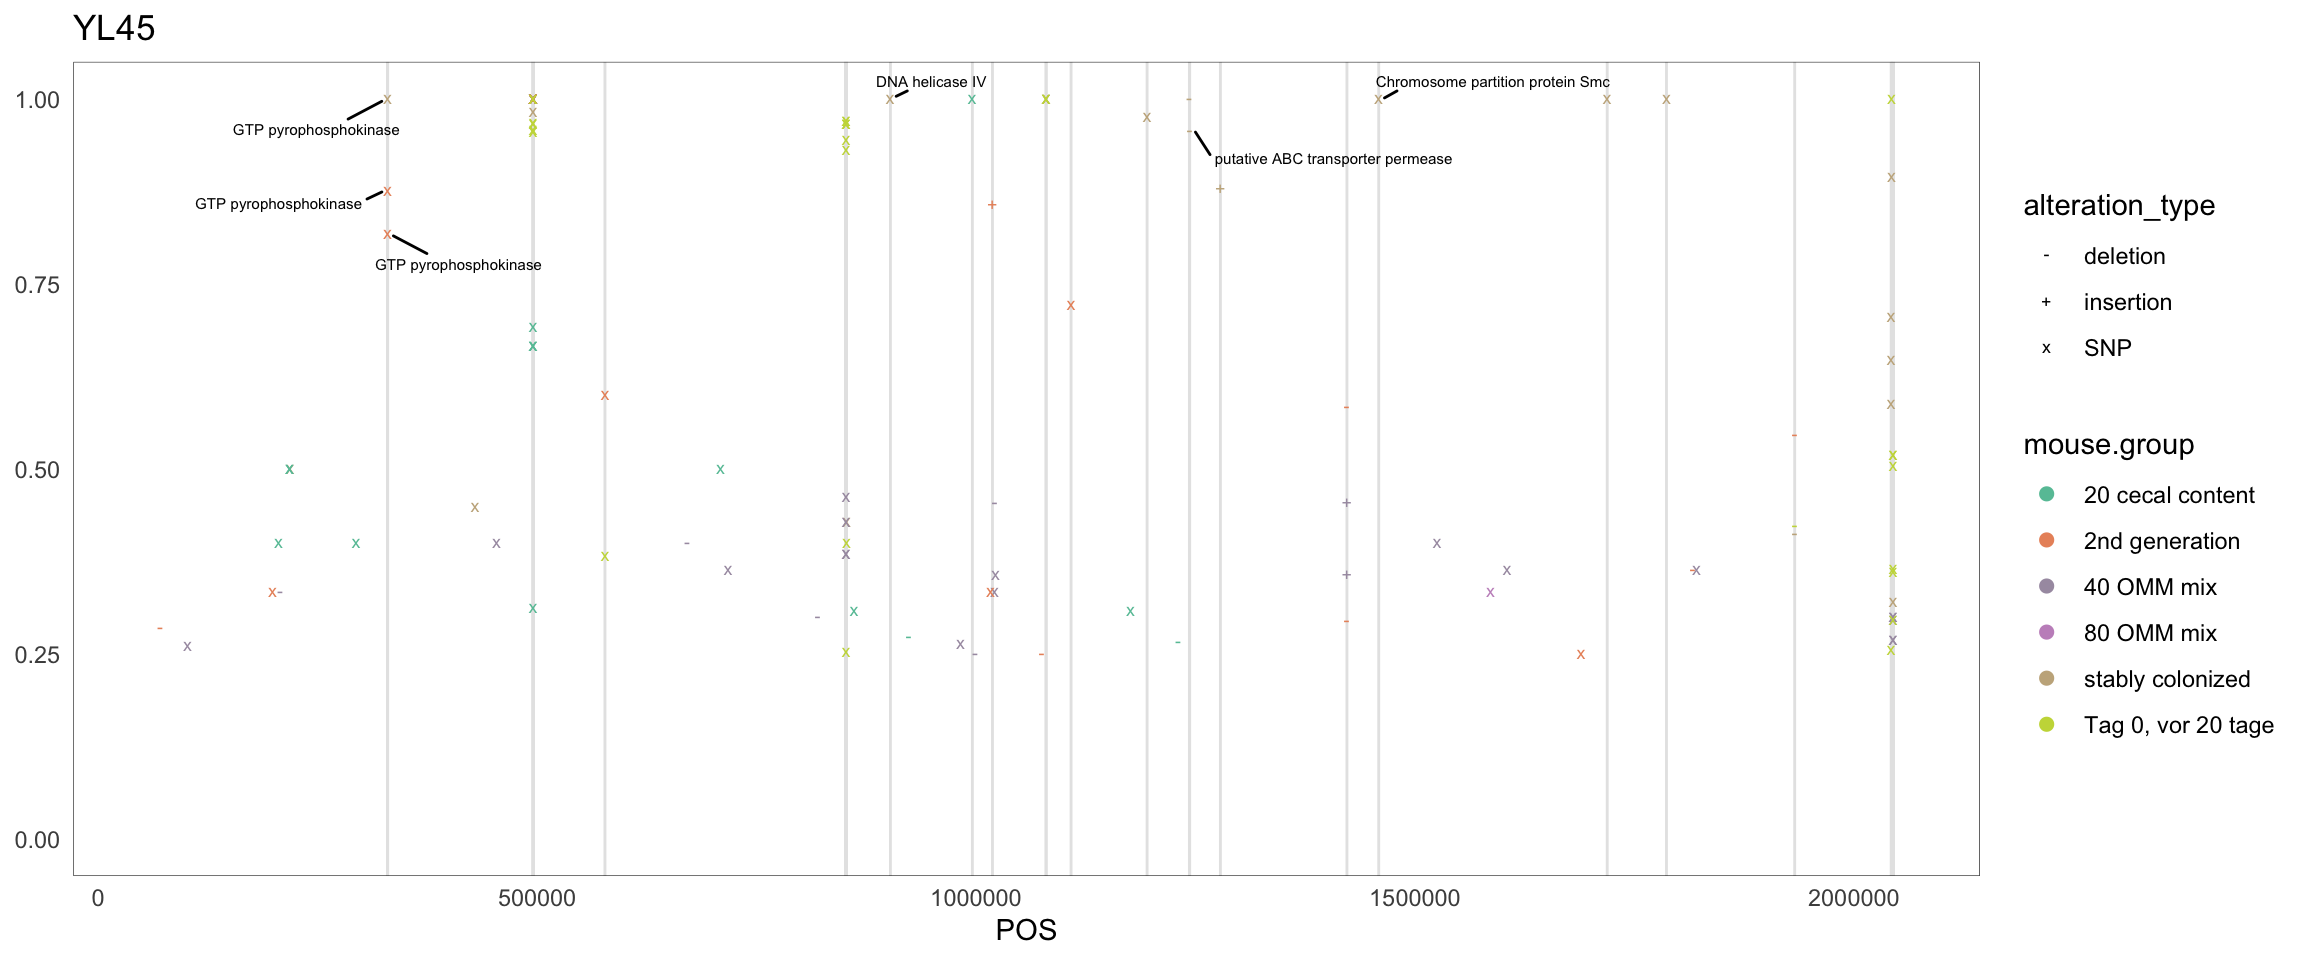
Figure 2.24: Position of variants. vertical lines show positions with functional annotation, if no annotation is shown, then its either hypothetical or outside ORF
## Warning in if (nchar(plot$labels$title %||% "") > 0) {: the condition has length > 1 and
## only the first element will be used
## Warning in geom2trace.default(dots[[1L]][[3L]], dots[[2L]][[1L]], dots[[3L]][[1L]]): geom_GeomTextRepel() has yet to be implemented in plotly.
## If you'd like to see this geom implemented,
## Please open an issue with your example code at
## https://github.com/ropensci/plotly/issues
## Warning in geom2trace.default(dots[[1L]][[3L]], dots[[2L]][[1L]], dots[[3L]][[1L]]): geom_GeomTextRepel() has yet to be implemented in plotly.
## If you'd like to see this geom implemented,
## Please open an issue with your example code at
## https://github.com/ropensci/plotly/issues
## Warning in geom2trace.default(dots[[1L]][[3L]], dots[[2L]][[1L]], dots[[3L]][[1L]]): geom_GeomTextRepel() has yet to be implemented in plotly.
## If you'd like to see this geom implemented,
## Please open an issue with your example code at
## https://github.com/ropensci/plotly/issuesFigure 2.25: Position of variants
2.11.10 Enterococcus_faecalis.1
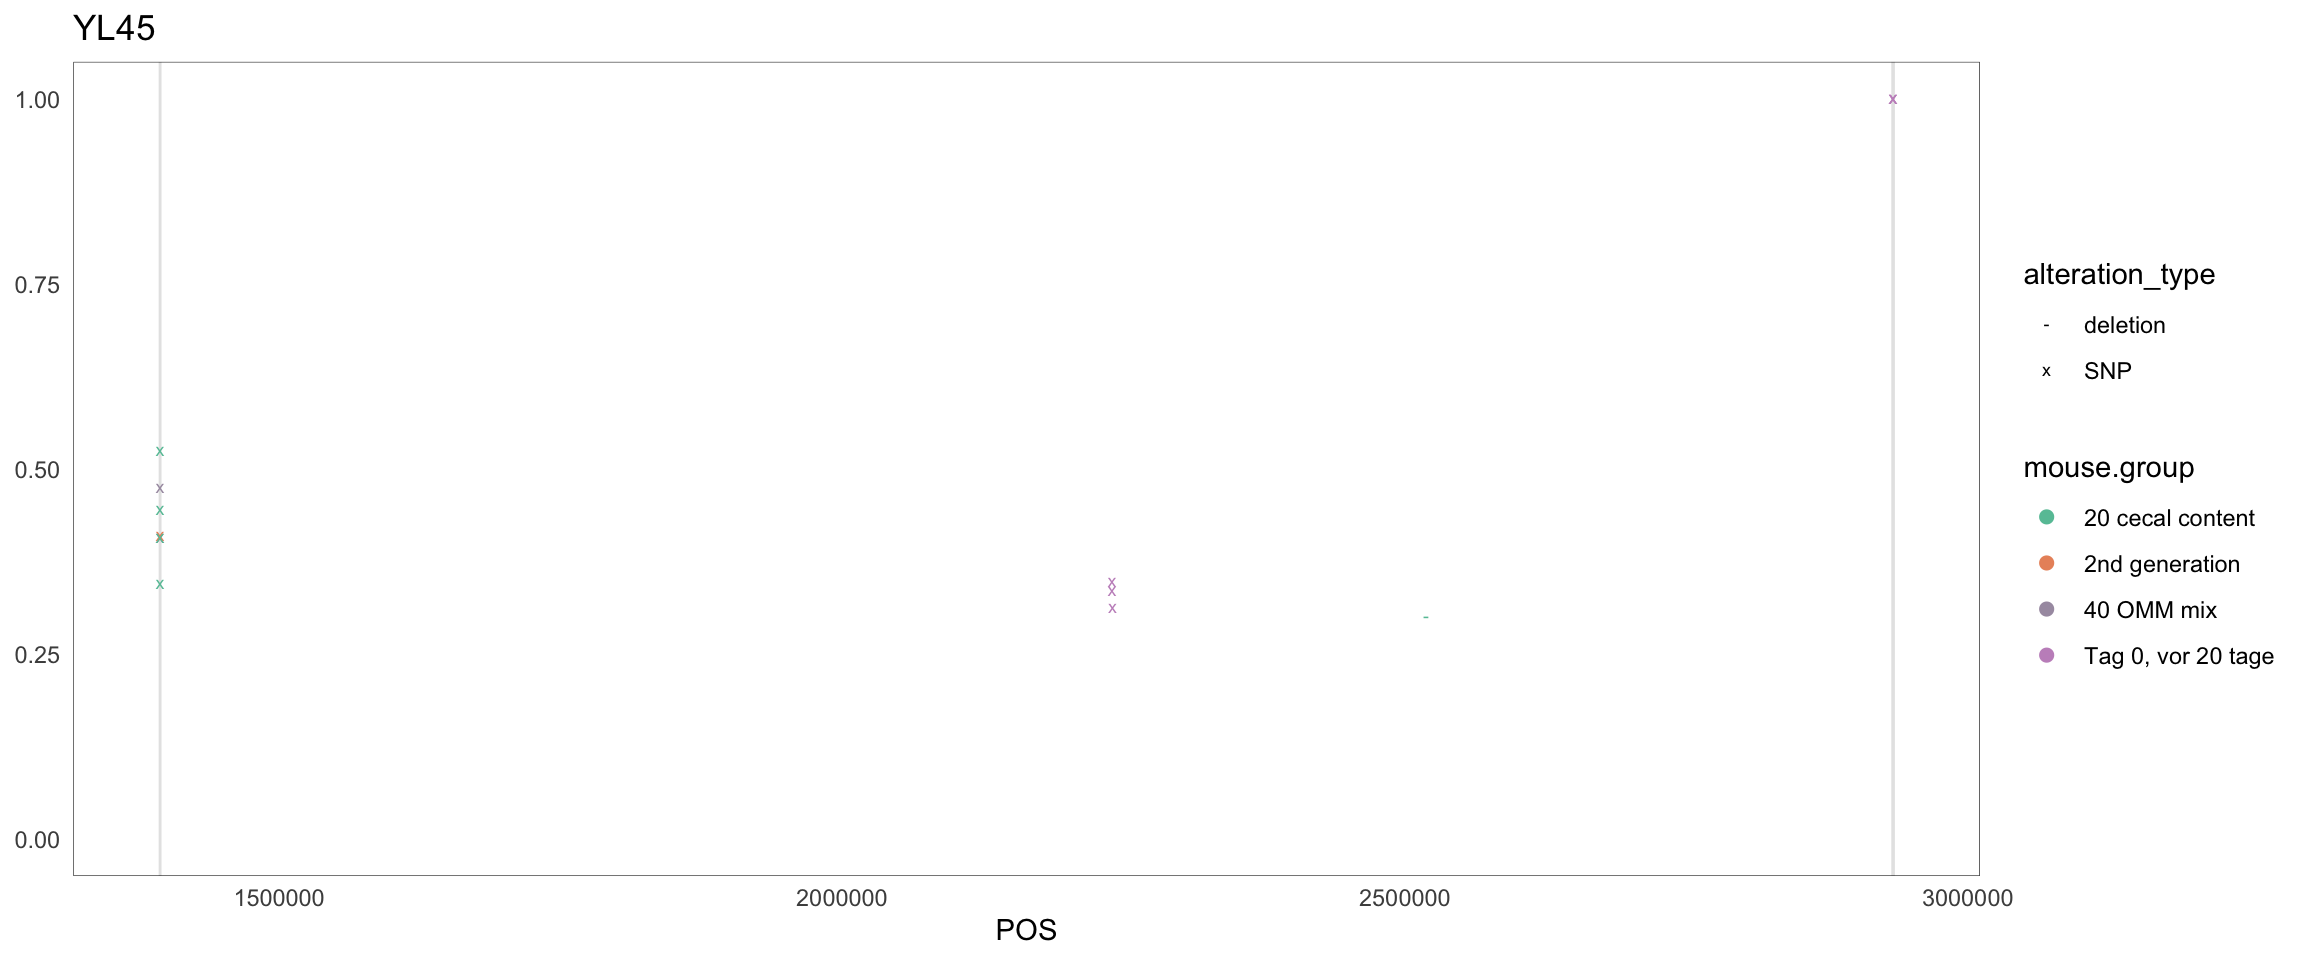
Figure 2.26: Position of variants. vertical lines show positions with functional annotation, if no annotation is shown, then its either hypothetical or outside ORF
## Warning in if (nchar(plot$labels$title %||% "") > 0) {: the condition has length > 1 and
## only the first element will be used
## Warning in geom2trace.default(dots[[1L]][[1L]], dots[[2L]][[1L]], dots[[3L]][[1L]]): geom_GeomTextRepel() has yet to be implemented in plotly.
## If you'd like to see this geom implemented,
## Please open an issue with your example code at
## https://github.com/ropensci/plotly/issuesFigure 2.27: Position of variants
2.11.11 Acutalibacter_muris
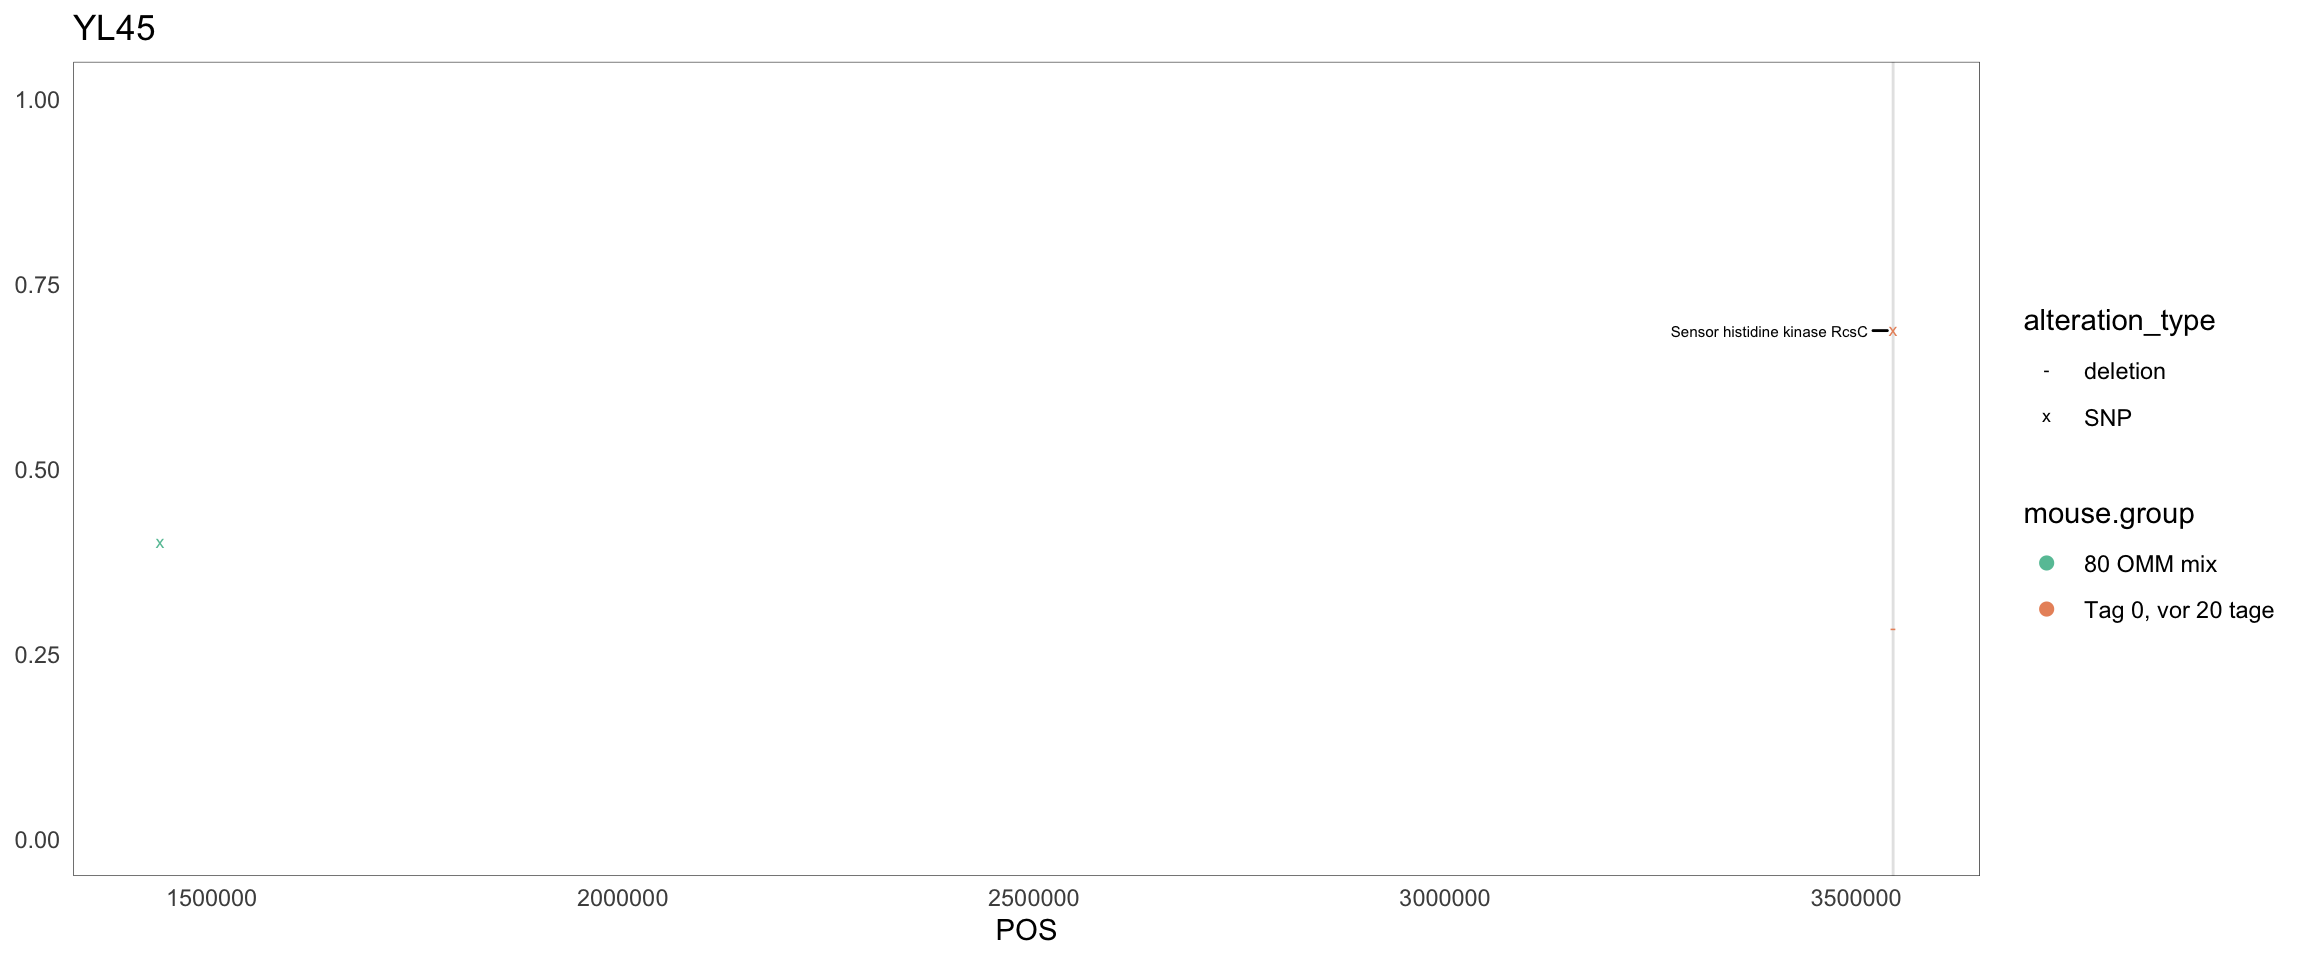
Figure 2.28: Position of variants. vertical lines show positions with functional annotation, if no annotation is shown, then its either hypothetical or outside ORF
## Warning in if (nchar(plot$labels$title %||% "") > 0) {: the condition has length > 1 and
## only the first element will be used
## Warning in geom2trace.default(dots[[1L]][[1L]], dots[[2L]][[1L]], dots[[3L]][[1L]]): geom_GeomTextRepel() has yet to be implemented in plotly.
## If you'd like to see this geom implemented,
## Please open an issue with your example code at
## https://github.com/ropensci/plotly/issuesFigure 2.29: Position of variants
2.11.12 Bifidobacterium_animalis_YL2_1
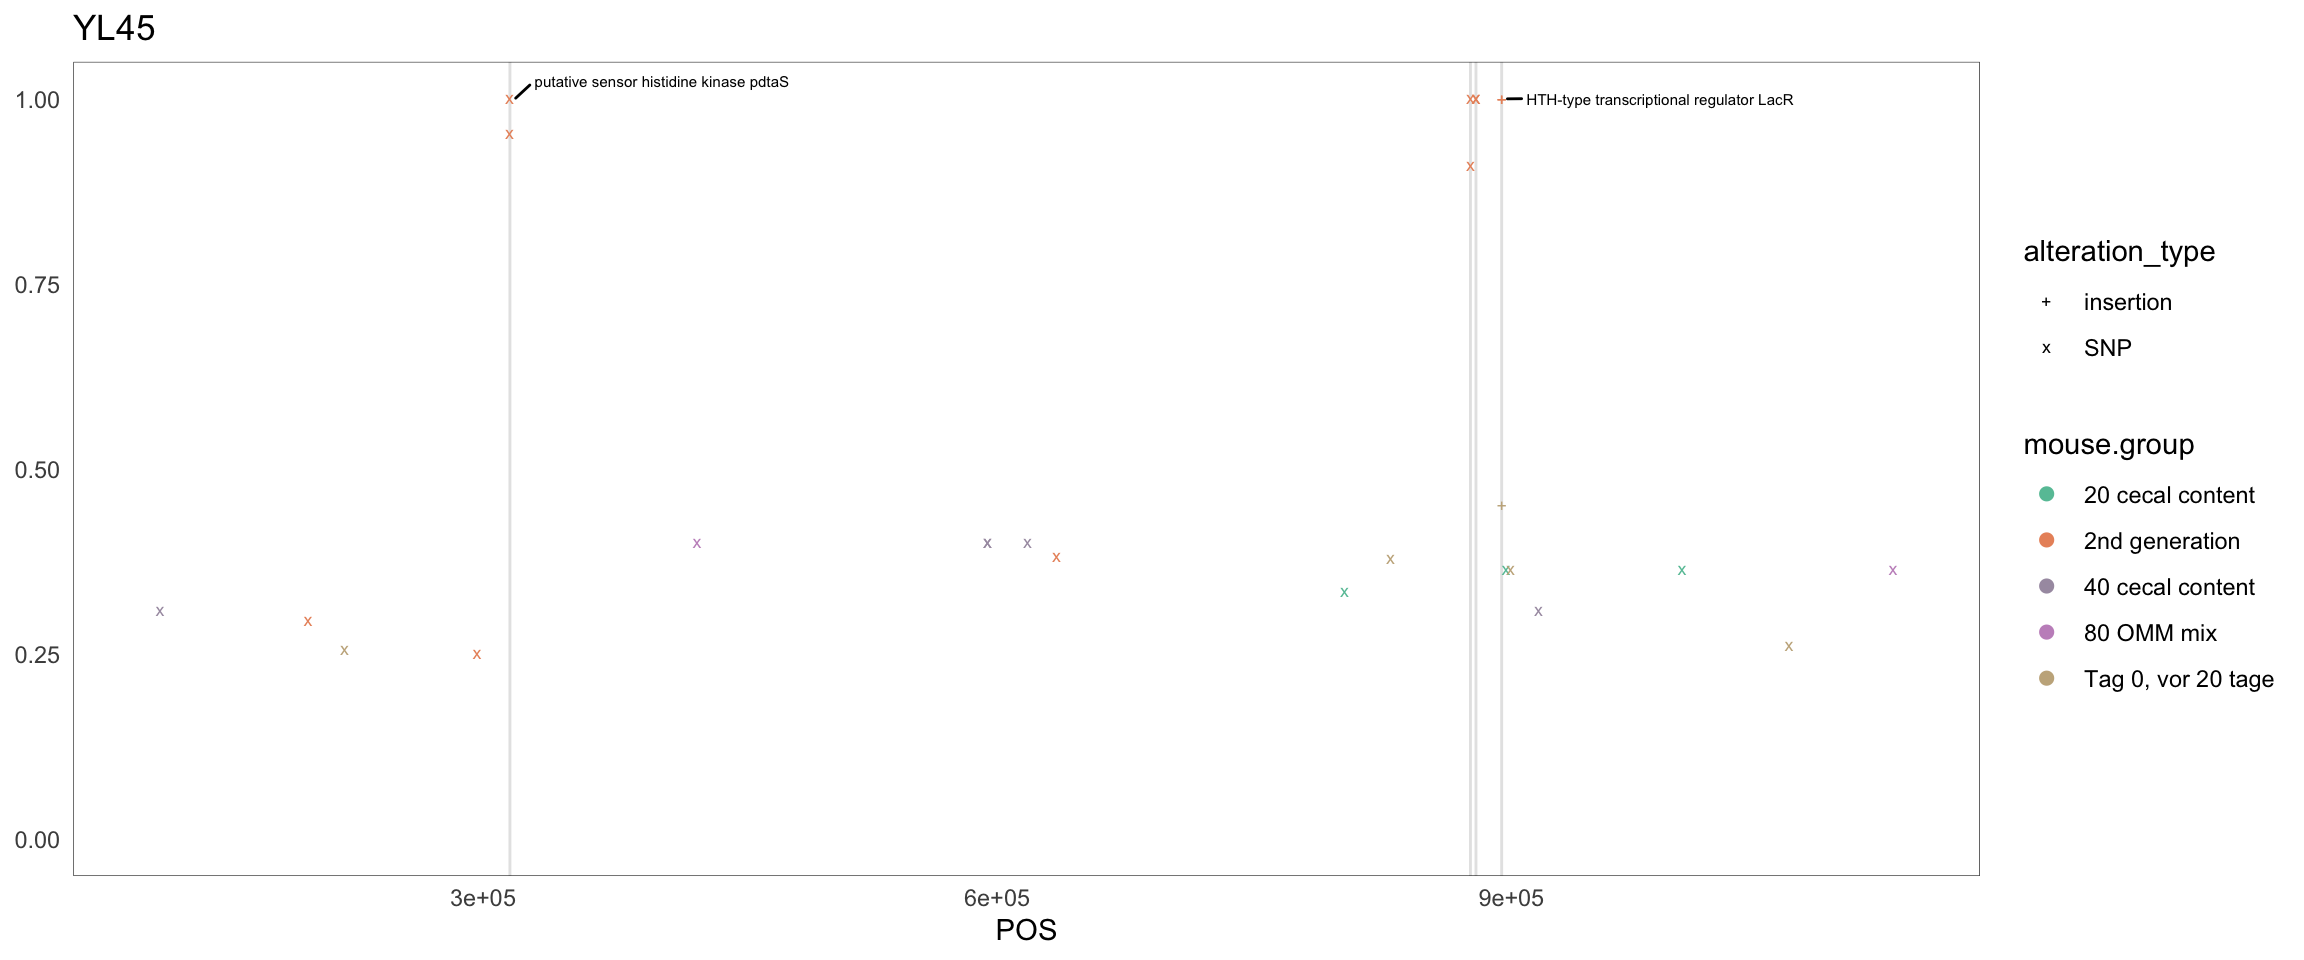
Figure 2.30: Position of variants. vertical lines show positions with functional annotation, if no annotation is shown, then its either hypothetical or outside ORF
## Warning in if (nchar(plot$labels$title %||% "") > 0) {: the condition has length > 1 and
## only the first element will be used
## Warning in geom2trace.default(dots[[1L]][[2L]], dots[[2L]][[1L]], dots[[3L]][[1L]]): geom_GeomTextRepel() has yet to be implemented in plotly.
## If you'd like to see this geom implemented,
## Please open an issue with your example code at
## https://github.com/ropensci/plotly/issues
## Warning in geom2trace.default(dots[[1L]][[2L]], dots[[2L]][[1L]], dots[[3L]][[1L]]): geom_GeomTextRepel() has yet to be implemented in plotly.
## If you'd like to see this geom implemented,
## Please open an issue with your example code at
## https://github.com/ropensci/plotly/issuesFigure 2.31: Position of variants
2.11.13 Bifidobacterium_animalis_YL2_2
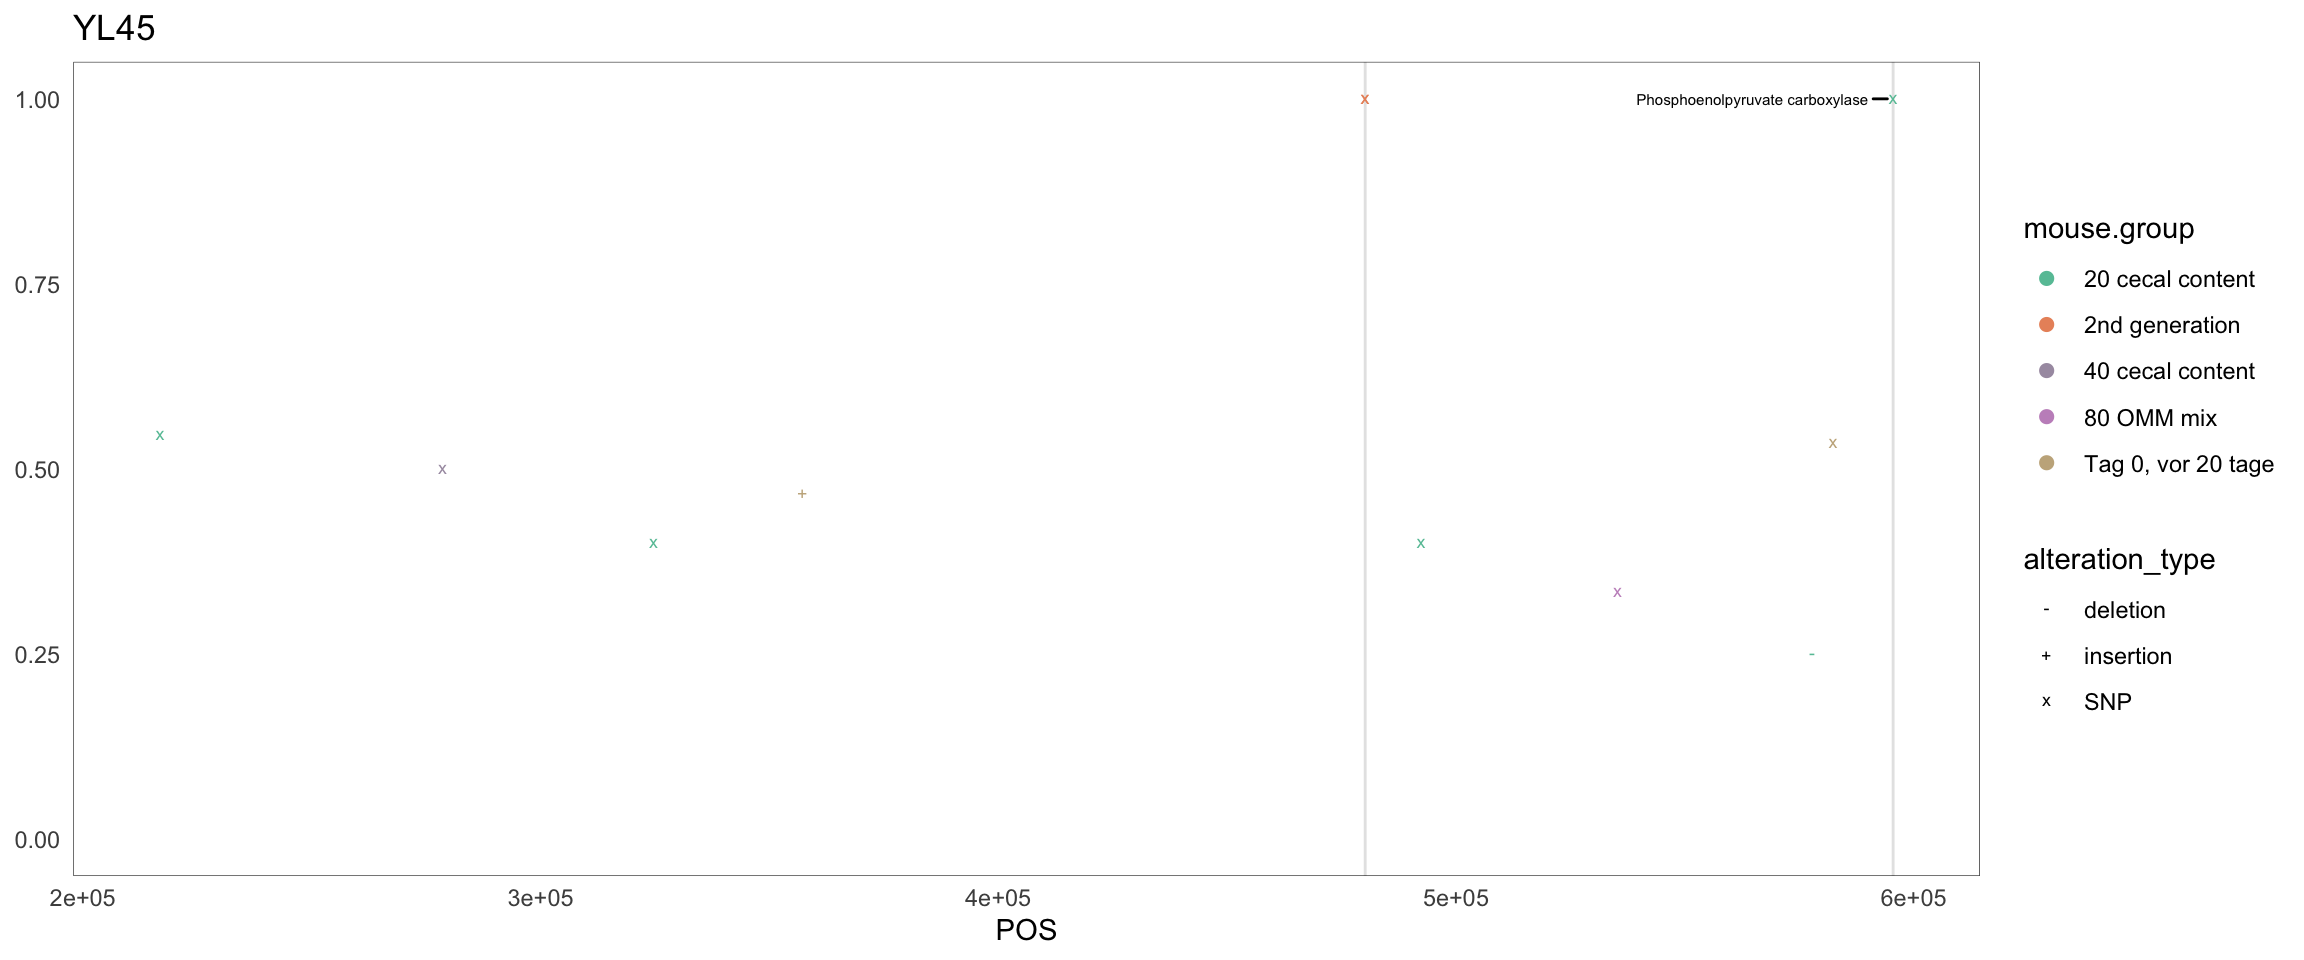
Figure 2.32: Position of variants. vertical lines show positions with functional annotation, if no annotation is shown, then its either hypothetical or outside ORF
## Warning in if (nchar(plot$labels$title %||% "") > 0) {: the condition has length > 1 and
## only the first element will be used
## Warning in geom2trace.default(dots[[1L]][[1L]], dots[[2L]][[1L]], dots[[3L]][[1L]]): geom_GeomTextRepel() has yet to be implemented in plotly.
## If you'd like to see this geom implemented,
## Please open an issue with your example code at
## https://github.com/ropensci/plotly/issuesFigure 2.33: Position of variants
2.11.14 CP028714.1
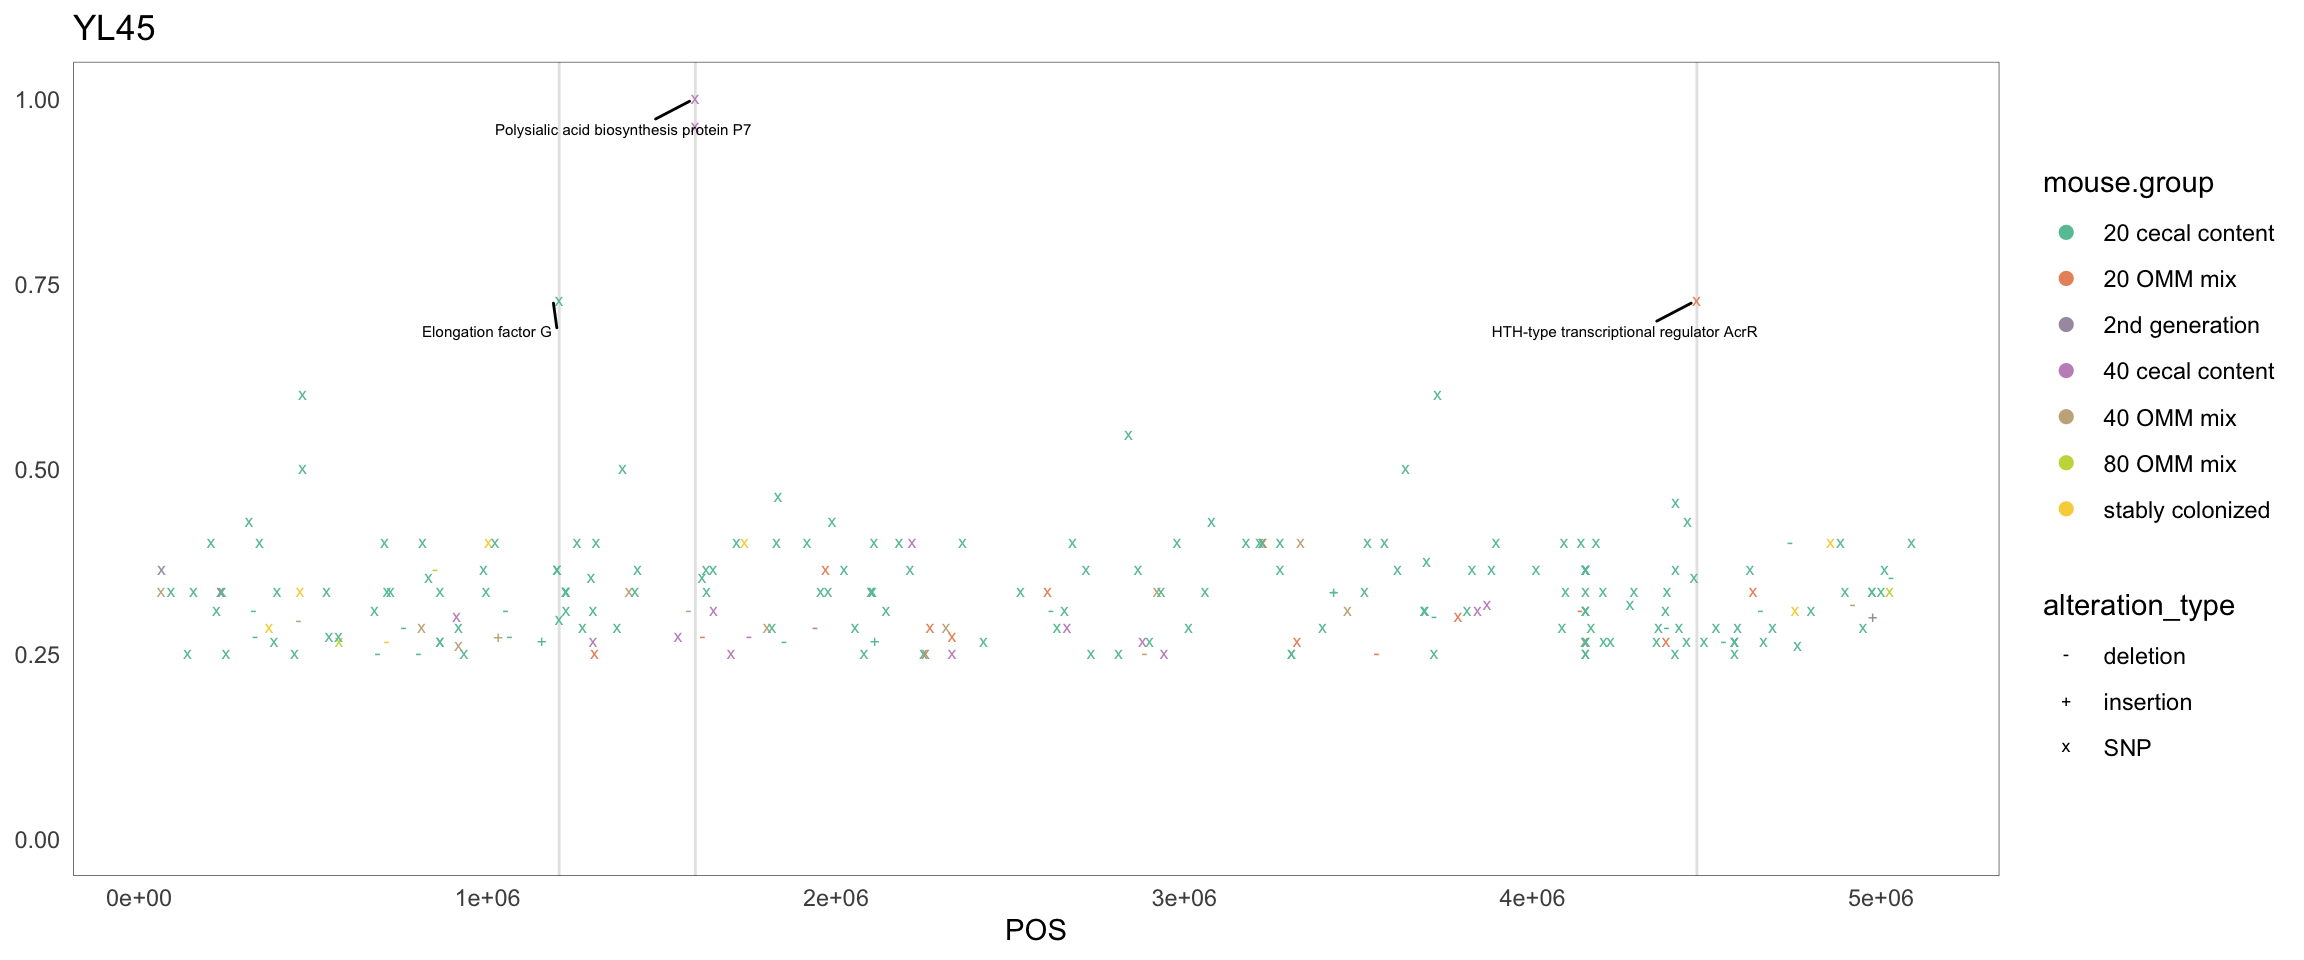
Figure 2.34: Position of variants. vertical lines show positions with functional annotation, if no annotation is shown, then its either hypothetical or outside ORF
## Warning in if (nchar(plot$labels$title %||% "") > 0) {: the condition has length > 1 and
## only the first element will be used
## Warning in geom2trace.default(dots[[1L]][[1L]], dots[[2L]][[1L]], dots[[3L]][[1L]]): geom_GeomTextRepel() has yet to be implemented in plotly.
## If you'd like to see this geom implemented,
## Please open an issue with your example code at
## https://github.com/ropensci/plotly/issuesFigure 2.35: Position of variants