Section 4 AB-effects (metagenomes)
4.1 Load in variants
vcfToDataframe <- function(vcf.files, contig_mapping = contig_mapping, gff.df = gff.df) {
require(vcfR)
res <- list()
for (file in vcf.files) {
library(data.table)
vcf.content <- vcfR::read.vcfR(file, verbose = FALSE)
vcf.fix <- as.data.frame(vcf.content@fix) # contains chr, position and substitution informations
vcf.info <- vcfR::INFO2df(vcf.content) # get INFO field, contains DP, AF informations
if (nrow(vcf.fix) > 0) {
# there are variants
dat <- as.data.frame(cbind(vcf.fix[, c(1, 2, 4, 5, 6)], vcf.info[, c(1, 2)]))
dat$majorAF <- sapply(dat$AF, minorAfToMajorAf) # transforms e.g. AF of 0.1 to 0.9, 0.9 stays 0.9 and 0.5 stays 0.5
dat$genome <- contig_mapping[match(dat$CHROM, contig_mapping$contig), ]$genome # map chr information to genome name e.g. NHMU01000001.1 -> i48
dat$genome_hr <- translateGenomeIdToFullName(tolower(dat$genome))
dat$mouse.id <- substr(tools::file_path_sans_ext(basename(file)), 1, 4)
dat$mouse.group <- translateMouseIdToTreatmentGroup(dat$mouse.id)
dat$day <- as.integer(substr(basename(file), 6, 7))
dat$phase <- binDaysByPhase(as.numeric(as.matrix(dat$day)))
dat$phase_num <- binDaysByPhaseGroup(dat$day)
dat$dp <- as.numeric(as.matrix(vcf.info$DP))
# annotate overlay of gene
dt.gff <- data.table(start = gff.df$start, end = gff.df$end, chr = as.character(as.matrix(gff.df$chr)),
feature = gff.df$product)
colnames(dat)[1:2] <- c("chr", "start")
dat$start <- as.integer(as.matrix(dat$start))
dat$chr <- as.character(as.matrix(dat$chr))
dat$end <- dat$start
dat2 <- as.data.table(dat)
setkey(dt.gff, chr, start, end)
annotated <- foverlaps(dat2, dt.gff, type = "within", mult = "first")
res[[tools::file_path_sans_ext(basename(file))]] <- annotated # add vcf df to list
} else {
message(paste("Skipping", file))
}
}
df <- as.data.frame(do.call(rbind, res)) # merge list to df
return(df)
}# load in reference information
gff.files <- Sys.glob("data/references/joined_reference_curated_ecoli/*.gff")
gff.df <- NULL
for (gff.file in gff.files) {
message(gff.file)
gff <- rtracklayer::readGFF(gff.file)
# subset since different columns are present on gff files
relevant <- data.frame(start = gff$start, end = gff$end, type = as.character(as.matrix(gff$type)),
gene = as.character(as.matrix(gff$gene)), product = as.character(as.matrix(gff$product)),
chr = as.character(as.matrix(gff$seqid)))
relevant$genome <- substr(basename(gff.file), 1, nchar(basename(gff.file)) - 4)
gff.df <- rbind(gff.df, relevant)
}## data/references/joined_reference_curated_ecoli/joined_reference_curated_ecoli.gff# load in contig information
contig_mapping <- read.csv2("data/contig_mapping_new_ref.csv", sep = ";", header = T, stringsAsFactors = F) # this file contains contig names of the 12 OligoMM genomes
# load in vcf files
vcf.files <- Sys.glob("out_philipp/all_vcf/*.vcf")
vcf.samples <- suppressWarnings(vcfToDataframe(vcf.files, contig_mapping, gff.df = gff.df))## Skipping out_philipp/all_vcf/1683d09_S49.vcfvcf.samples$feature <- as.character(as.matrix(vcf.samples$feature))
vcf.samples[which(is.na(vcf.samples$feature)), ]$feature <- "outside ORFs"
vcf.samples$start <- NULL
vcf.samples$end <- NULL
vcf.samples$i.end <- NULL
colnames(vcf.samples)[3] <- "POS"
vcf.samples$ref_size <- nchar(as.character(as.matrix(vcf.samples$REF)))
vcf.samples$alt_size <- nchar(as.character(as.matrix(vcf.samples$ALT)))
vcf.samples$alteration <- paste(as.character(vcf.samples$REF), "->", as.character(vcf.samples$ALT))
vcf.samples$alteration_type <- "SNP"
vcf.samples[which(vcf.samples$ref_size < vcf.samples$alt_size), ]$alteration_type <- "insertion"
vcf.samples[which(vcf.samples$ref_size > vcf.samples$alt_size), ]$alteration_type <- "deletion"
saveRDS(vcf.samples, file = "data/rds/omm_ab.rds")4.2 add presence in reseq experiment
load in variants from resequencing run and mark if the variants form this study overlap
dat <- readRDS("data/rds/omm_ab.rds")
dat_re <- readRDS("data/rds/reseq.rds")
dat_re$variant.id <- paste(dat_re$chr, dat_re$POS, dat_re$REF, dat_re$ALT, sep = "-")
# consiger there if AF is > .5
dat_re <- dat_re[which(dat_re$AF > 0.5), ]Save as table
dat <- readRDS("data/rds/omm_ab.rds")
write.table(vcf_samples, file = "results/tables/omm_antibiotic_variants_long.csv", sep = ";",
col.names = T, row.names = F, quote = F)
dat$variant.id <- paste(dat$chr, dat$POS, dat$REF, dat$ALT, sep = "-")
dat$fixed <- FALSE
dat[which(!is.na(match(dat$variant.id, dat_re$variant.id))), ]$fixed <- TRUE
saveRDS(dat, file = "data/rds/omm_ab_with_fixed.rds")4.3 AF frequency
p <- ggplot(vcf.samples, aes(AF, fill = genome)) + geom_histogram()
p <- p + facet_grid(mouse.id + mouse.group ~ genome + genome_hr)
p <- p + theme_classic() + xlab("AF") + ylab("occurence")
print(p)## `stat_bin()` using `bins = 30`. Pick better value with `binwidth`.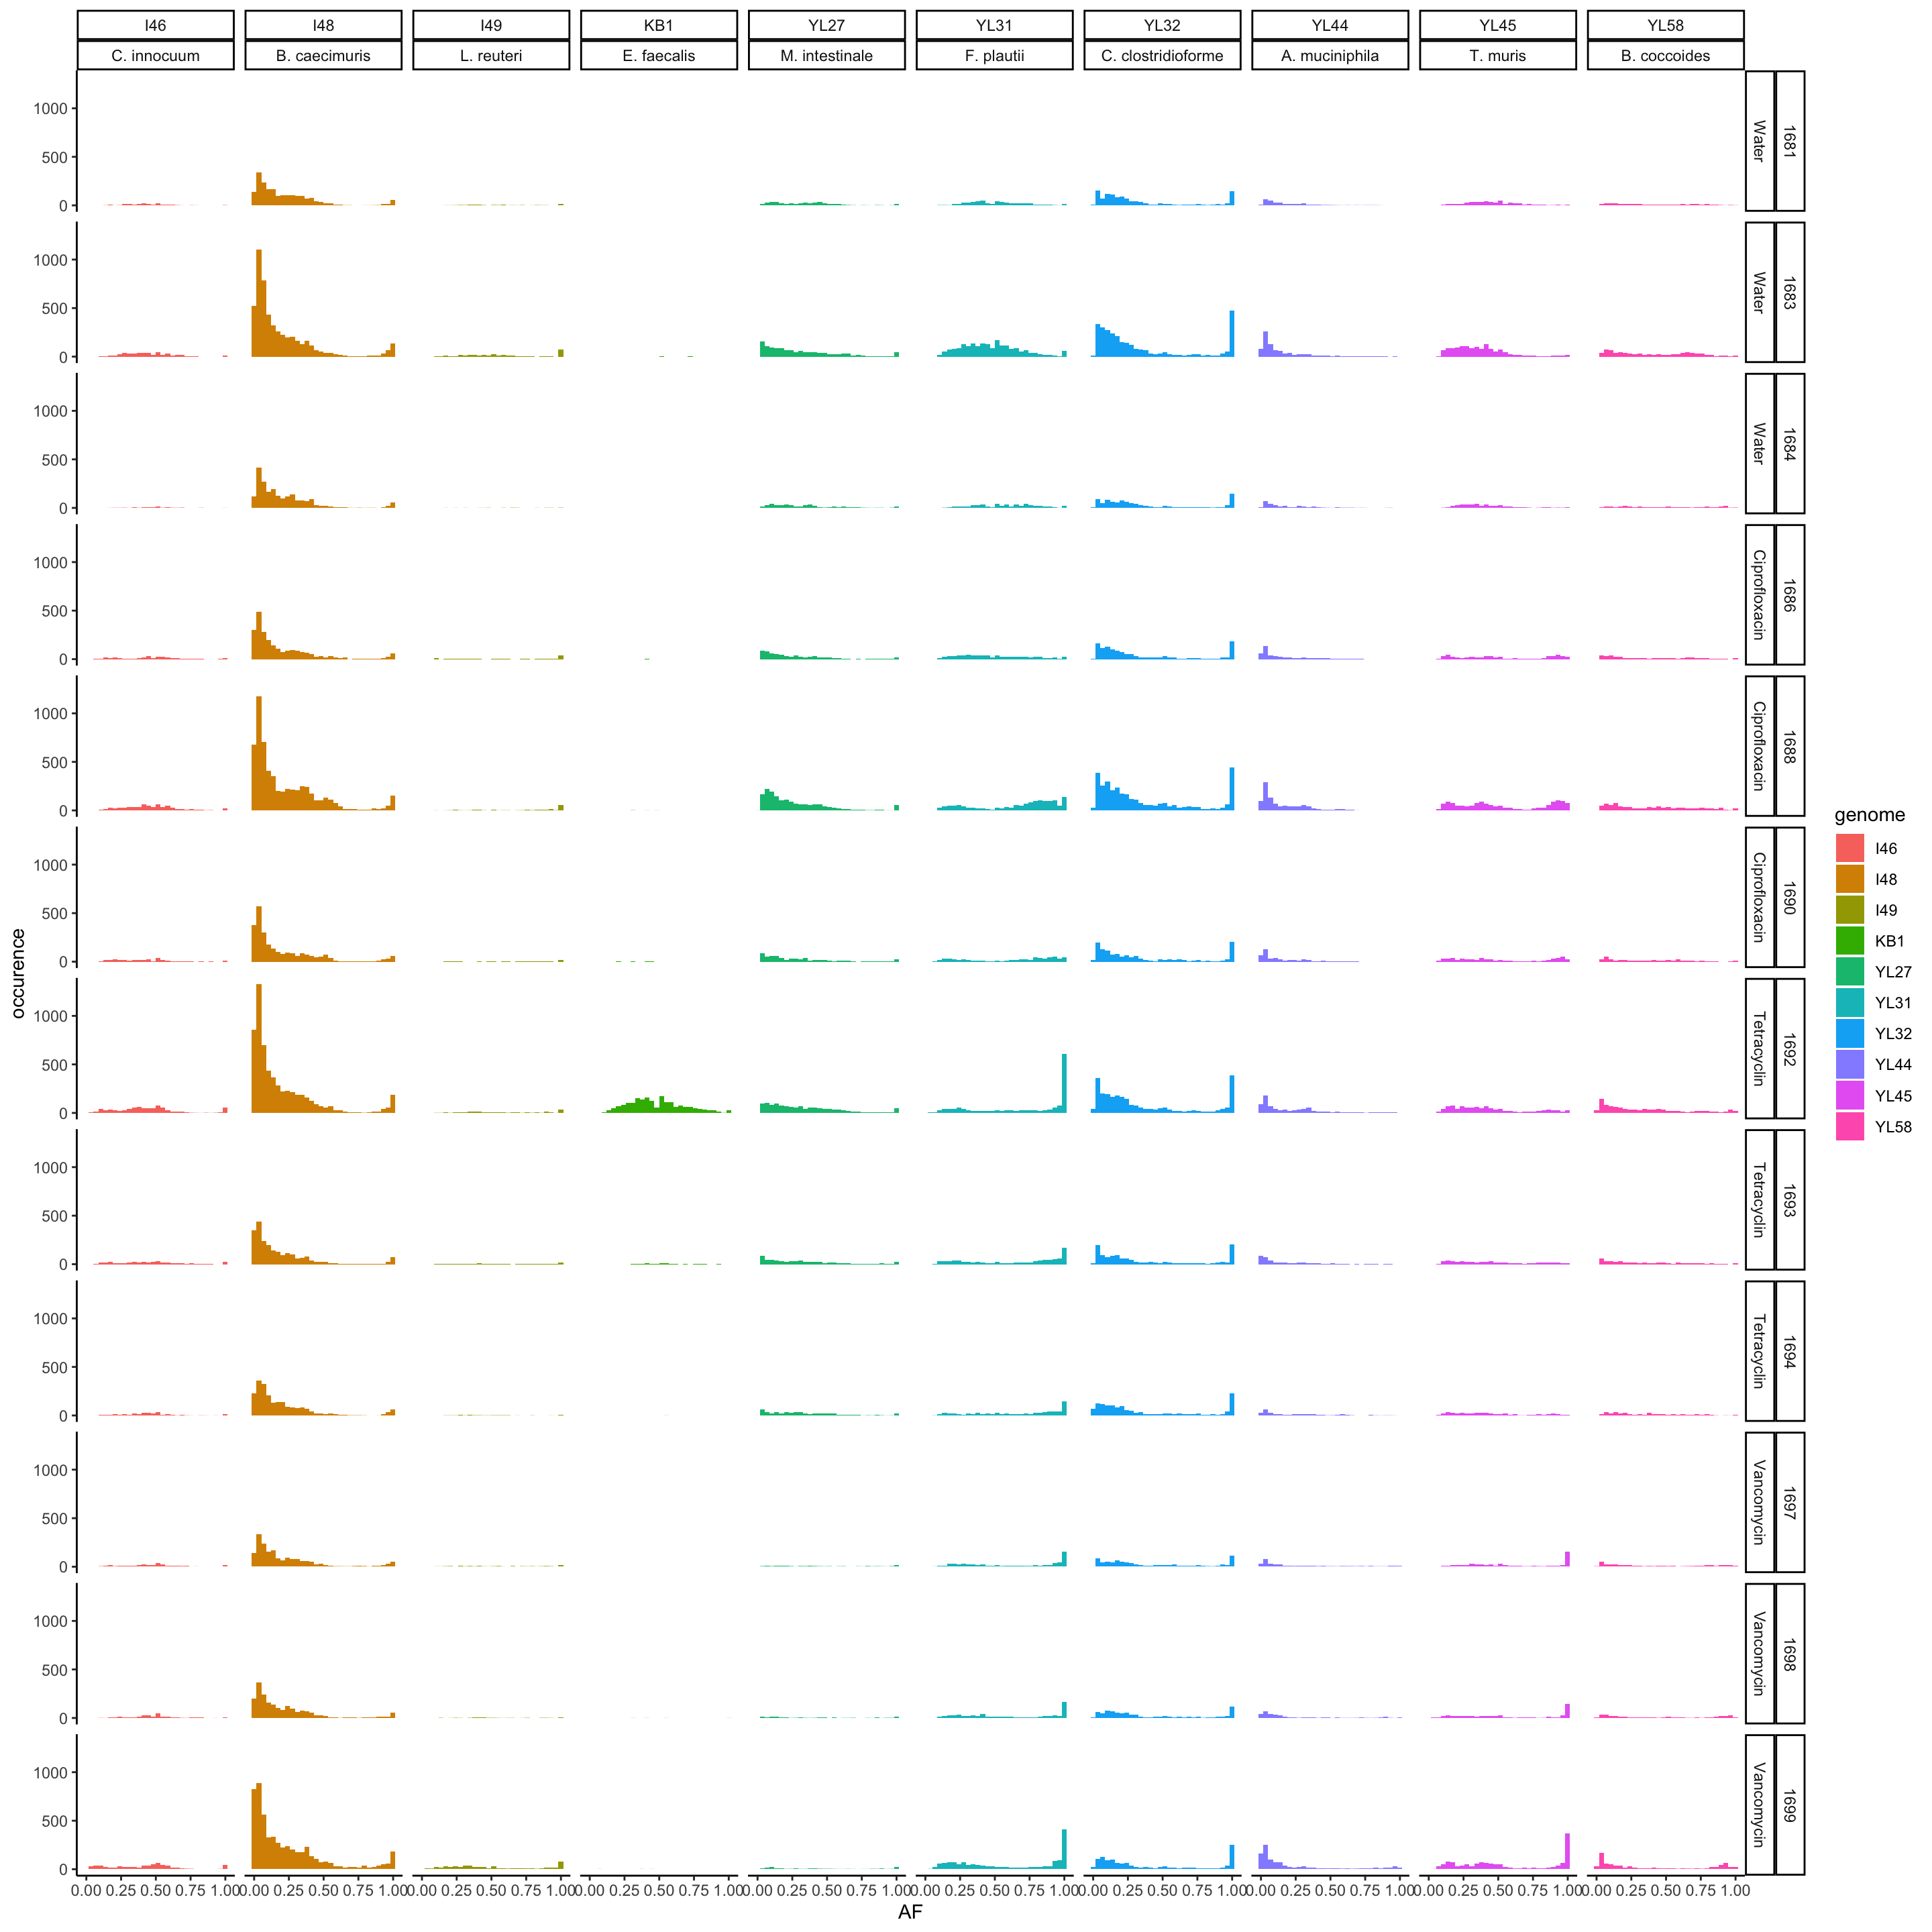
Figure 4.1: AF of resequenced strains
p <- ggplot(vcf.samples, aes(majorAF, fill = genome)) + geom_histogram()
p <- p + facet_grid(mouse.id + mouse.group ~ genome + genome_hr)
p <- p + theme_classic() + xlab("AF") + ylab("occurence")
print(p)## `stat_bin()` using `bins = 30`. Pick better value with `binwidth`.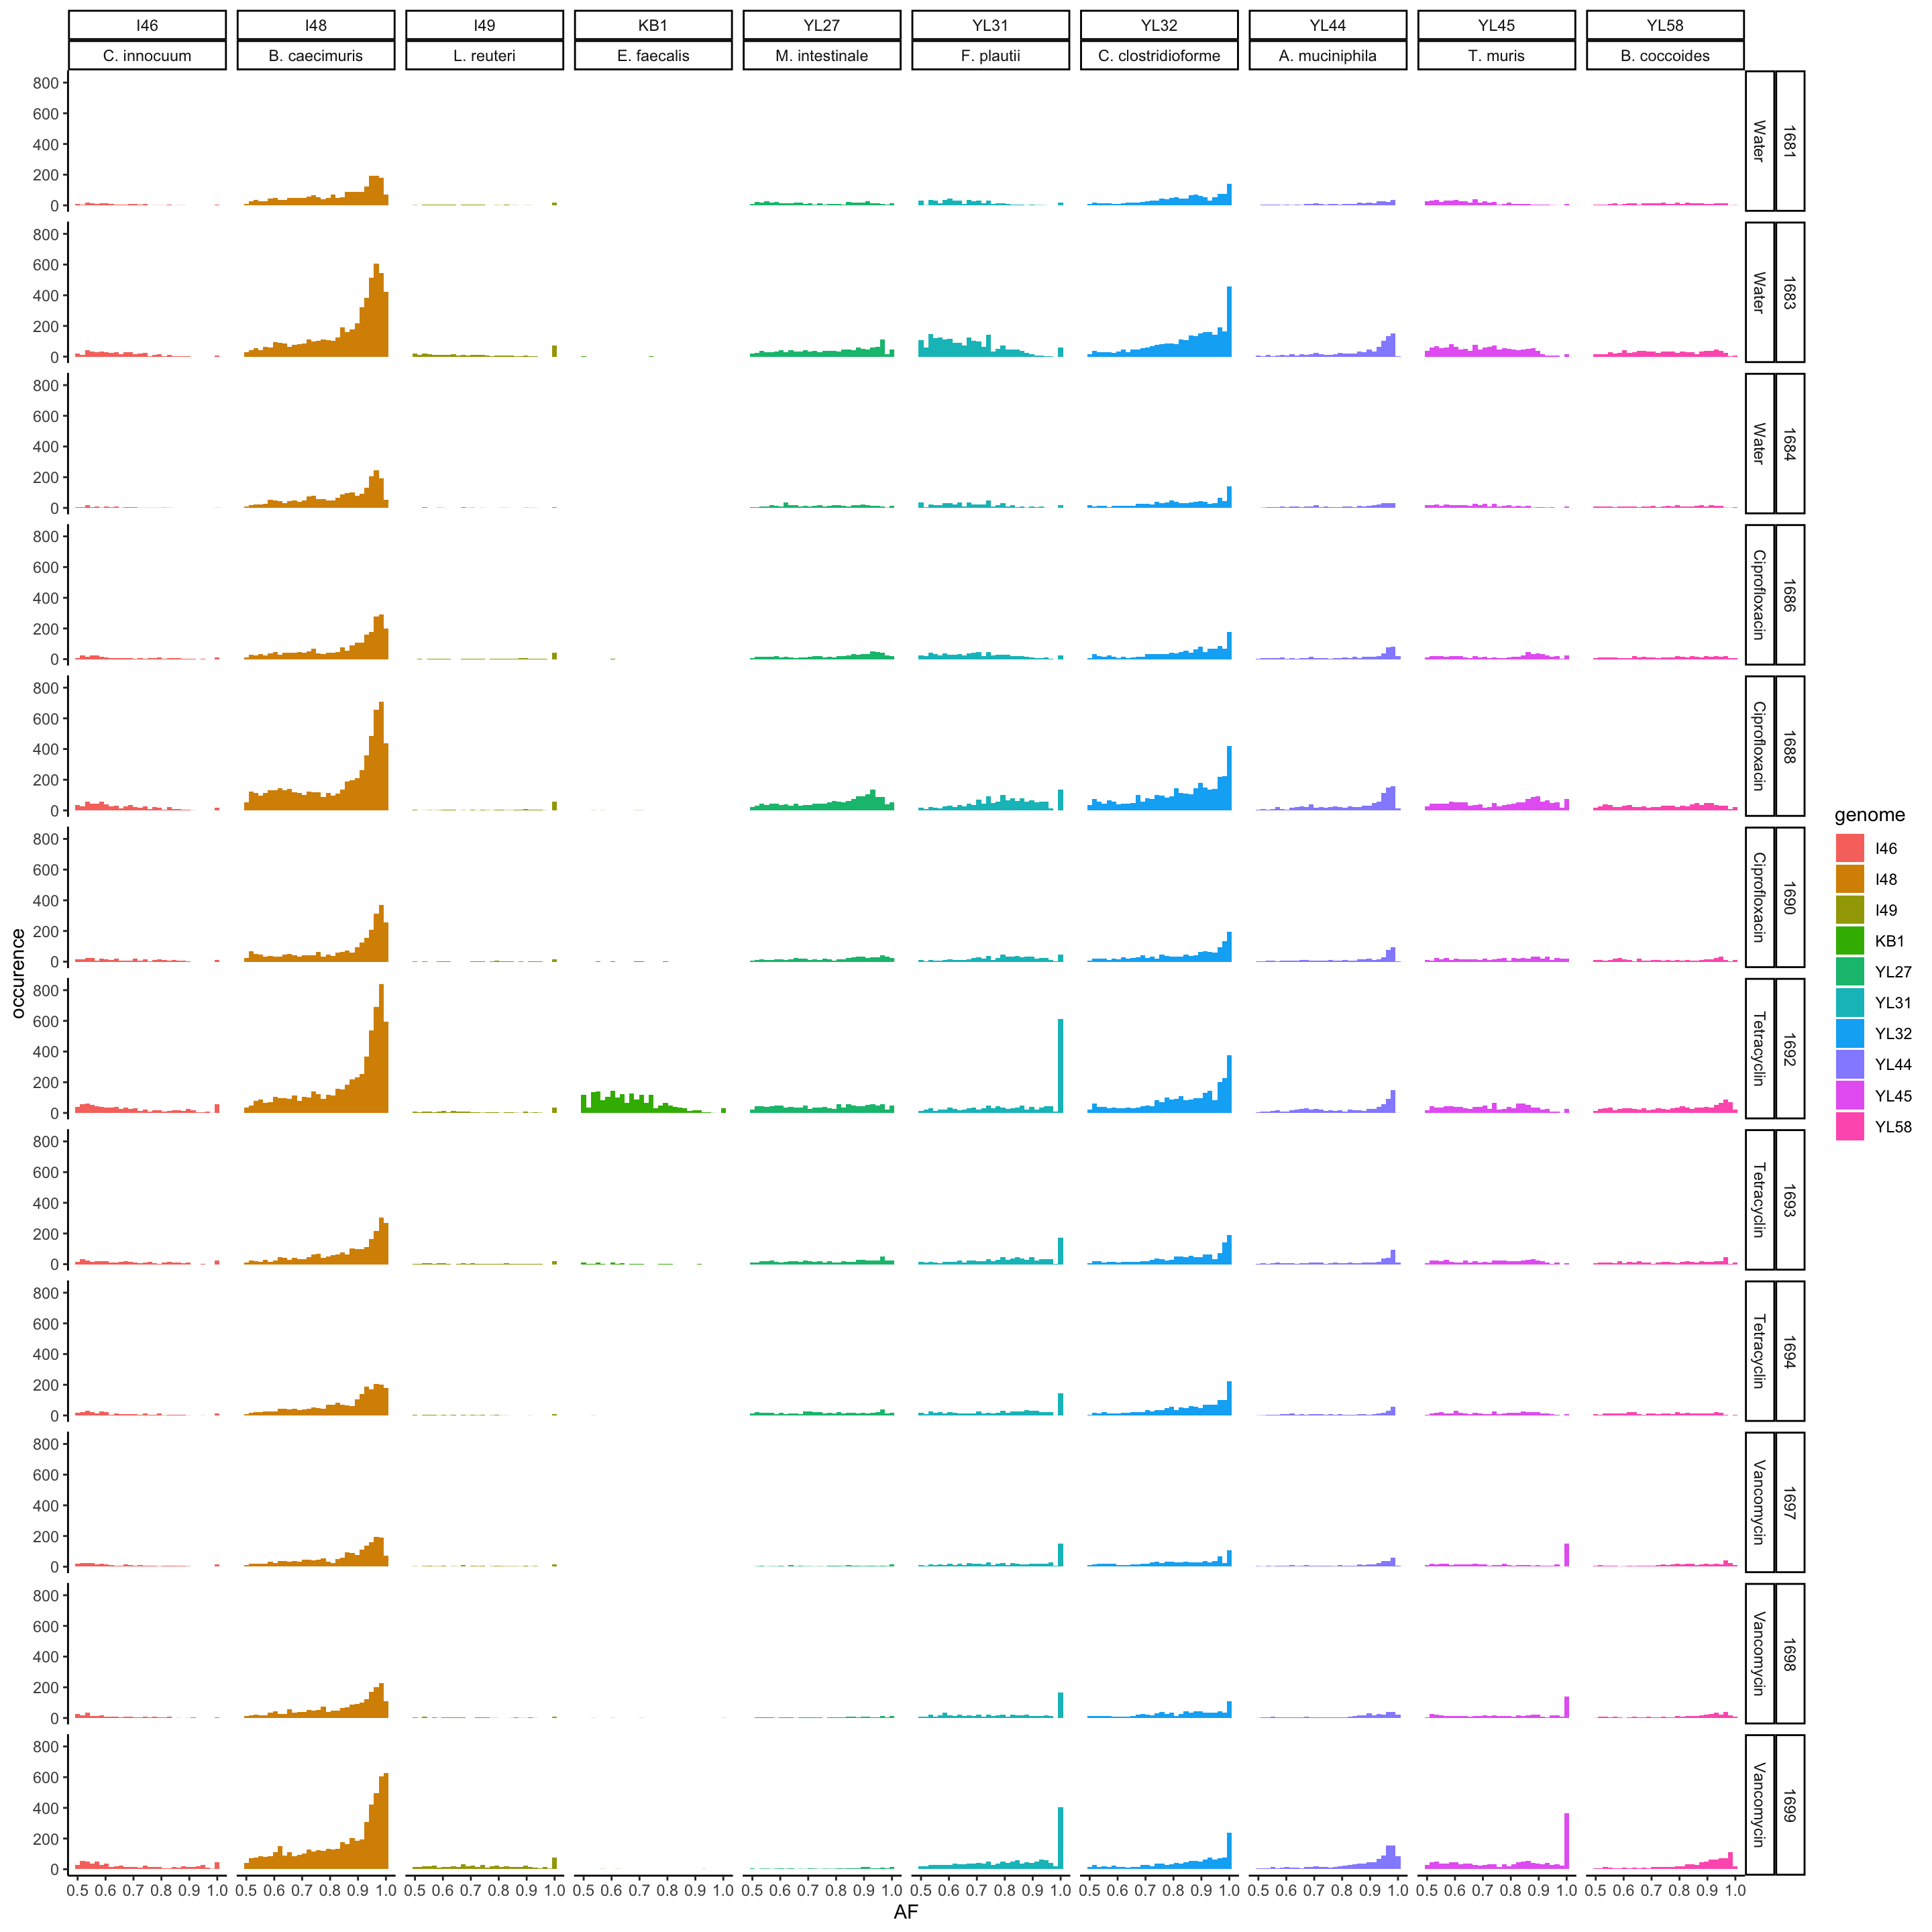
Figure 4.2: major AF of resequenced strains
4.4 Average coverage of variants by genome
dat <- readRDS("data/rds/omm_ab.rds")
dat_subset <- dat[which(dat$mouse.group == "Water"), ]
p <- ggplot(dat_subset, aes(x = reorder(genome, -DP), y = DP, color = genome)) + geom_boxplot()
p <- p + theme_classic() + xlab("AF") + ylab("depth of variant")
p <- p + scale_y_log10()
print(p)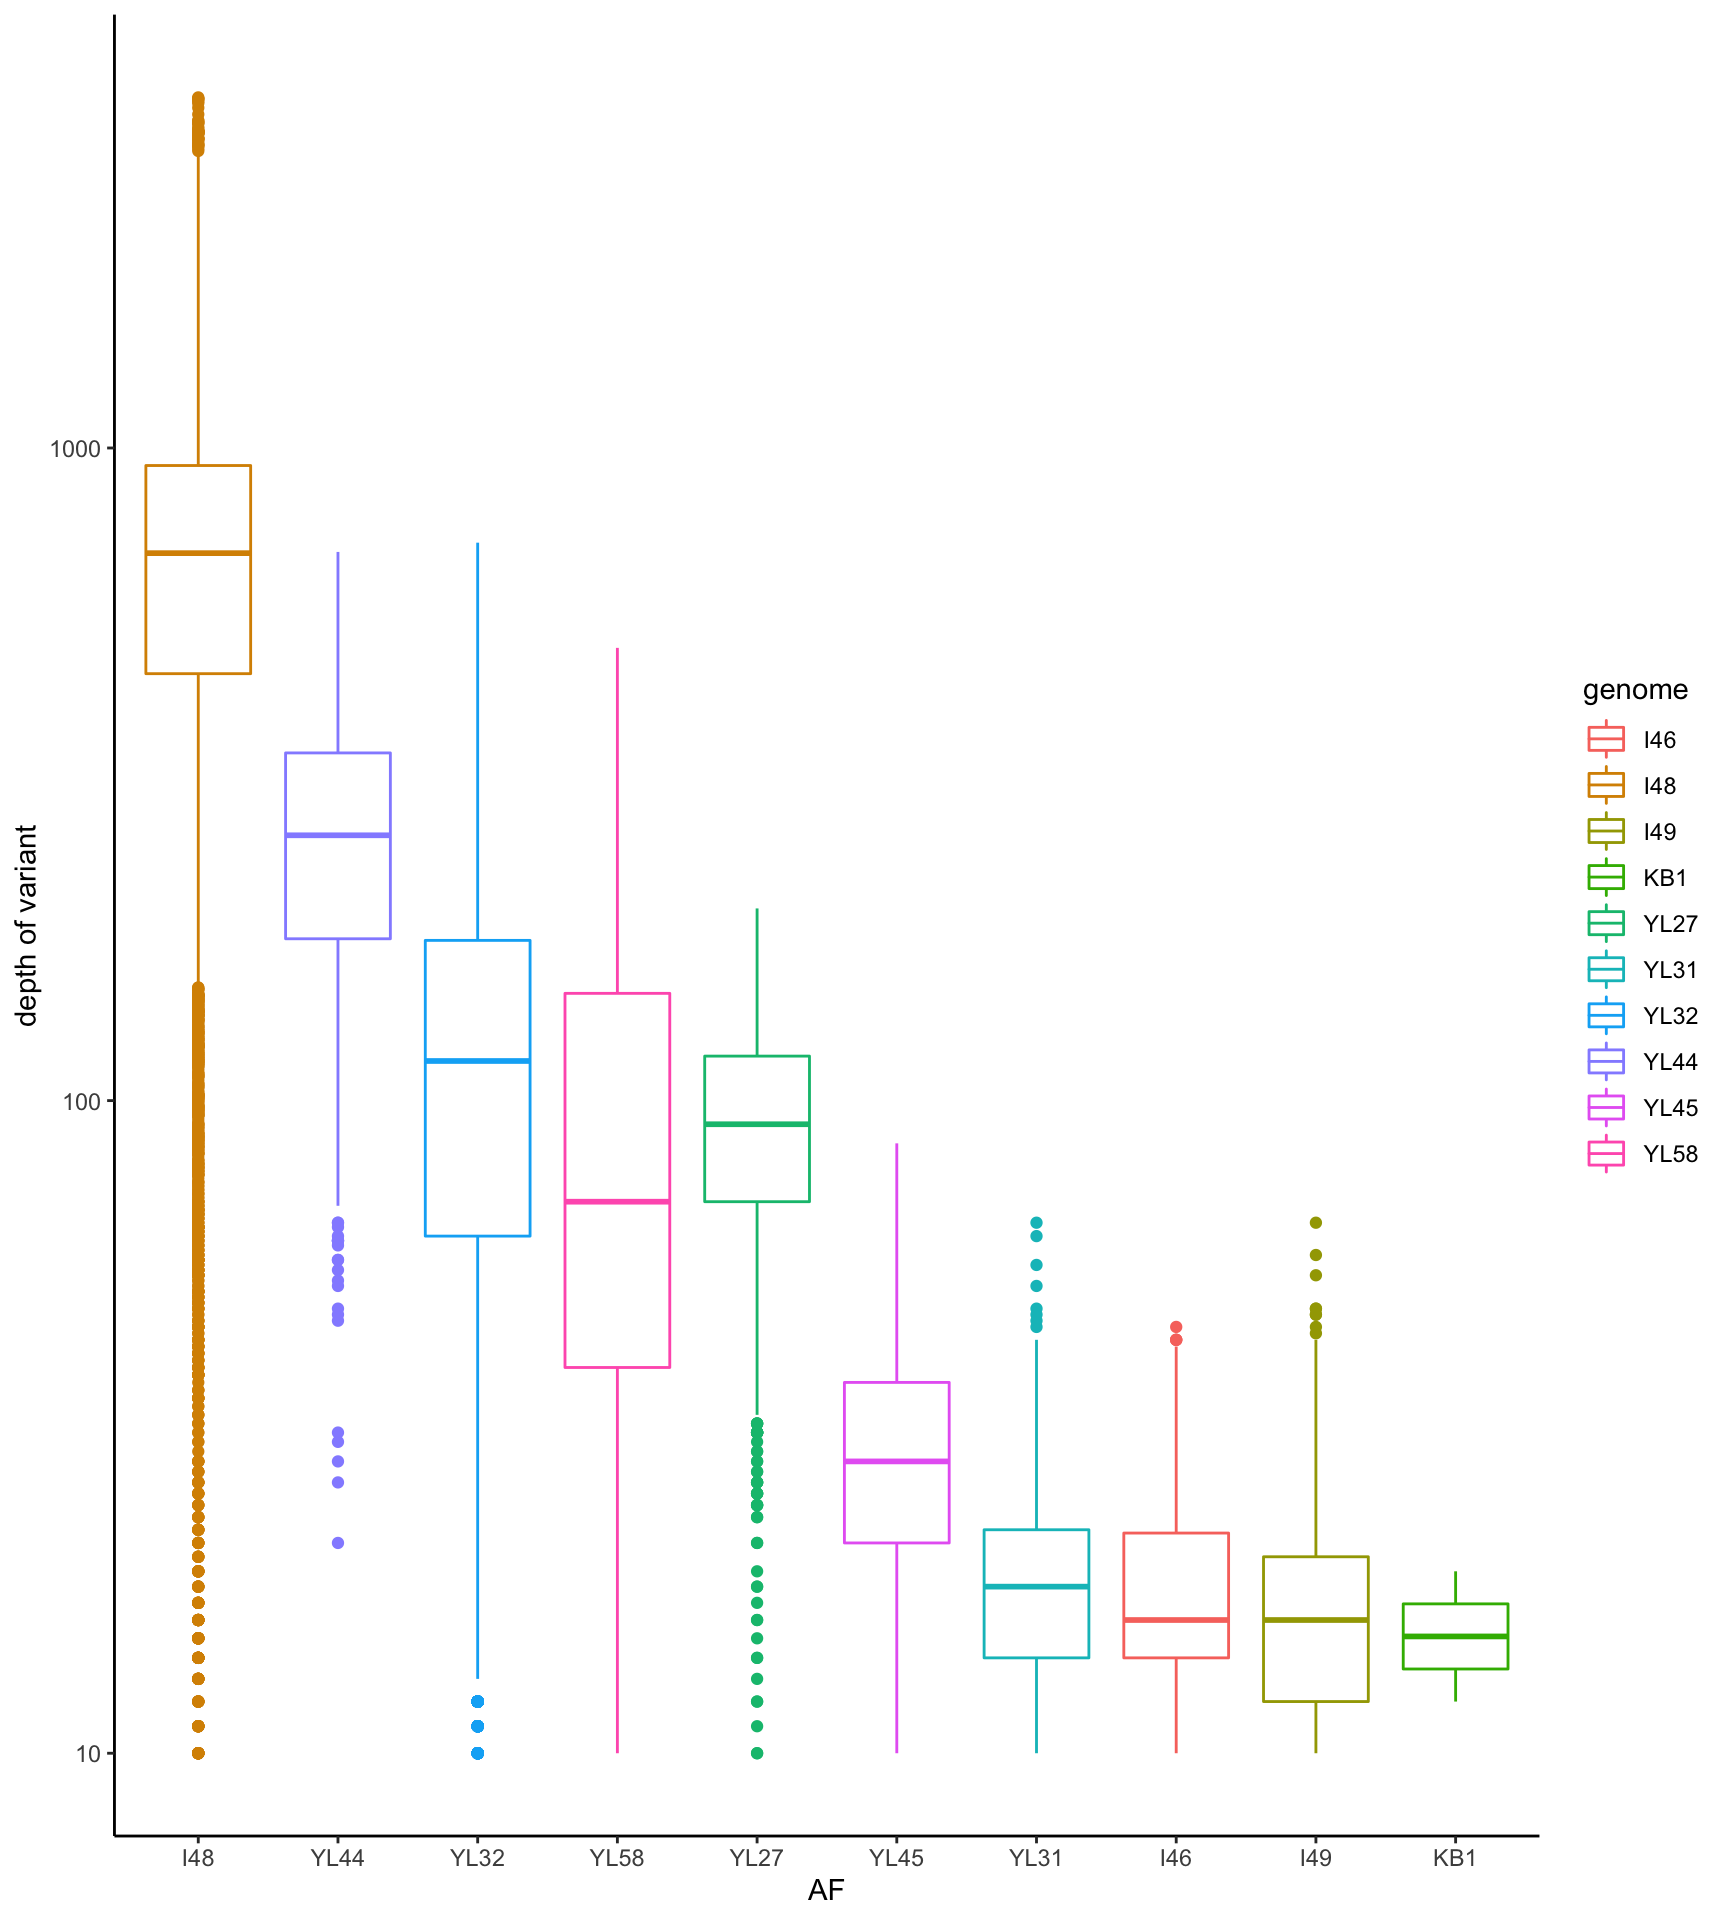
4.5 number of variants per samples
dat <- readRDS("data/rds/omm_ab.rds")
dat$dummy <- 1
dat.agg <- aggregate(dummy ~ mouse.id + mouse.group + day + phase, dat, sum)
DT::datatable(dat.agg)4.5.1 number of variants per treatment group
p <- ggplot(dat.agg, aes(x = mouse.id, y = dummy, color = day))
p <- p + geom_jitter(shape = 4) + facet_grid(. ~ mouse.group, scales = "free_x")
p <- p + geom_boxplot() + theme_classic() + xlab("Mouse ID") + ylab("number of variants")
plotly::ggplotly(p)Figure 4.3: number of variants of all 12 OMM genomes by mouse
4.6 Heatmap
All mice
dat <- readRDS("data/rds/omm_ab.rds")
dat$sample.id <- paste0(dat$mouse.id, "-", dat$day)
dat$variant.id <- paste0(dat$POS, "-", dat$REF, "-", dat$ALT)
data.wide <- dcast(dat, variant.id ~ sample.id, value.var = "AF")## Warning in dcast(dat, variant.id ~ sample.id, value.var = "AF"): The dcast generic
## in data.table has been passed a data.frame and will attempt to redirect to the
## reshape2::dcast; please note that reshape2 is deprecated, and this redirection is now
## deprecated as well. Please do this redirection yourself like reshape2::dcast(dat). In the
## next version, this warning will become an error.data.wide[is.na(data.wide)] <- 0
rownames(data.wide) <- data.wide$variant.id
data.wide$variant.id <- NULL
library(circlize)
library(ComplexHeatmap)
heat <- data.matrix(data.wide)
# limit to variants that are present in at least 10% of samples
heat_num <- rowSums(heat != 0)
heat2 <- heat[which(heat_num > ncol(heat)/10), ]
# limit to variants that have a high variance
heat_var_num <- matrixStats::rowVars(heat2)
heat3 <- heat2[which(heat_var_num > quantile(heat_var_num, 0.5)), ]
dat$dummy <- 1
annot.data <- aggregate(dummy ~ mouse.id + mouse.group + day + phase, dat, sum)
annot.data$sample.id <- paste0(annot.data$mouse.id, "-", annot.data$day)
heat3.mouse.id <- annot.data[match(colnames(heat3), annot.data$sample.id), ]$mouse.id
heat3.day <- annot.data[match(colnames(heat3), annot.data$sample.id), ]$day
heat3.mouse.group <- annot.data[match(colnames(heat3), annot.data$sample.id), ]$mouse.group
heat3.phase <- annot.data[match(colnames(heat3), annot.data$sample.id), ]$phase
heat3.phase2 <- ifelse(heat3.phase == "post-treatment", 6, NA)
ord = data.frame(day = heat3.day, mouse.id = heat3.mouse.id)
occ = as.data.frame(table(heat3.mouse.id))
ord$occ <- occ[match(ord$mouse.id, occ$heat3.mouse.id), ]$Freq
data.wide.sub <- dat[match(colnames(heat3), dat$sample.id), ]
col_fun = colorRamp2(c(0, 0.5, 1), c("white", "yellow", "red"))
qpcr <- read.table("qpcr.csv", header = T, sep = ";")
qpcr$universal <- NULL
rownames(qpcr) <- paste0(qpcr$mouse, "-", qpcr$day)
qpcr <- qpcr[, -c(1:5)]
qpcr <- apply(qpcr, 1, function(x) x/sum(x))
qpcr <- qpcr[, which(colnames(qpcr) %in% colnames(heat3))]
qpcr <- qpcr[, match(colnames(heat3), colnames(qpcr))]
# pdf('heat.pdf', width= 10, height = 10)
Heatmap(heat3, name = "AF", col = col_fun, border = TRUE, top_annotation = HeatmapAnnotation(num = anno_lines(colSums(heat3),
smooth = TRUE, border = TRUE), ra = anno_barplot(t(qpcr), bar_width = 1, gp = gpar(fill = 1:12),
height = unit(3, "cm")), mouse = heat3.mouse.id, group = heat3.mouse.group, phase = heat3.phase,
day = anno_simple(heat3.day, pch = heat3.phase2)), cluster_columns = F, column_order = order(ord$occ,
ord$mouse.id, ord$day), right_annotation = rowAnnotation(prev = anno_barplot(rowSums(heat3))),
row_gap = unit(0, "mm"), column_gap = unit(0, "mm"), column_split = heat3.mouse.group, column_names_gp = gpar(fontsize = 5),
row_names_gp = gpar(fontsize = 3), show_row_dend = F, show_row_names = F, show_column_dend = F)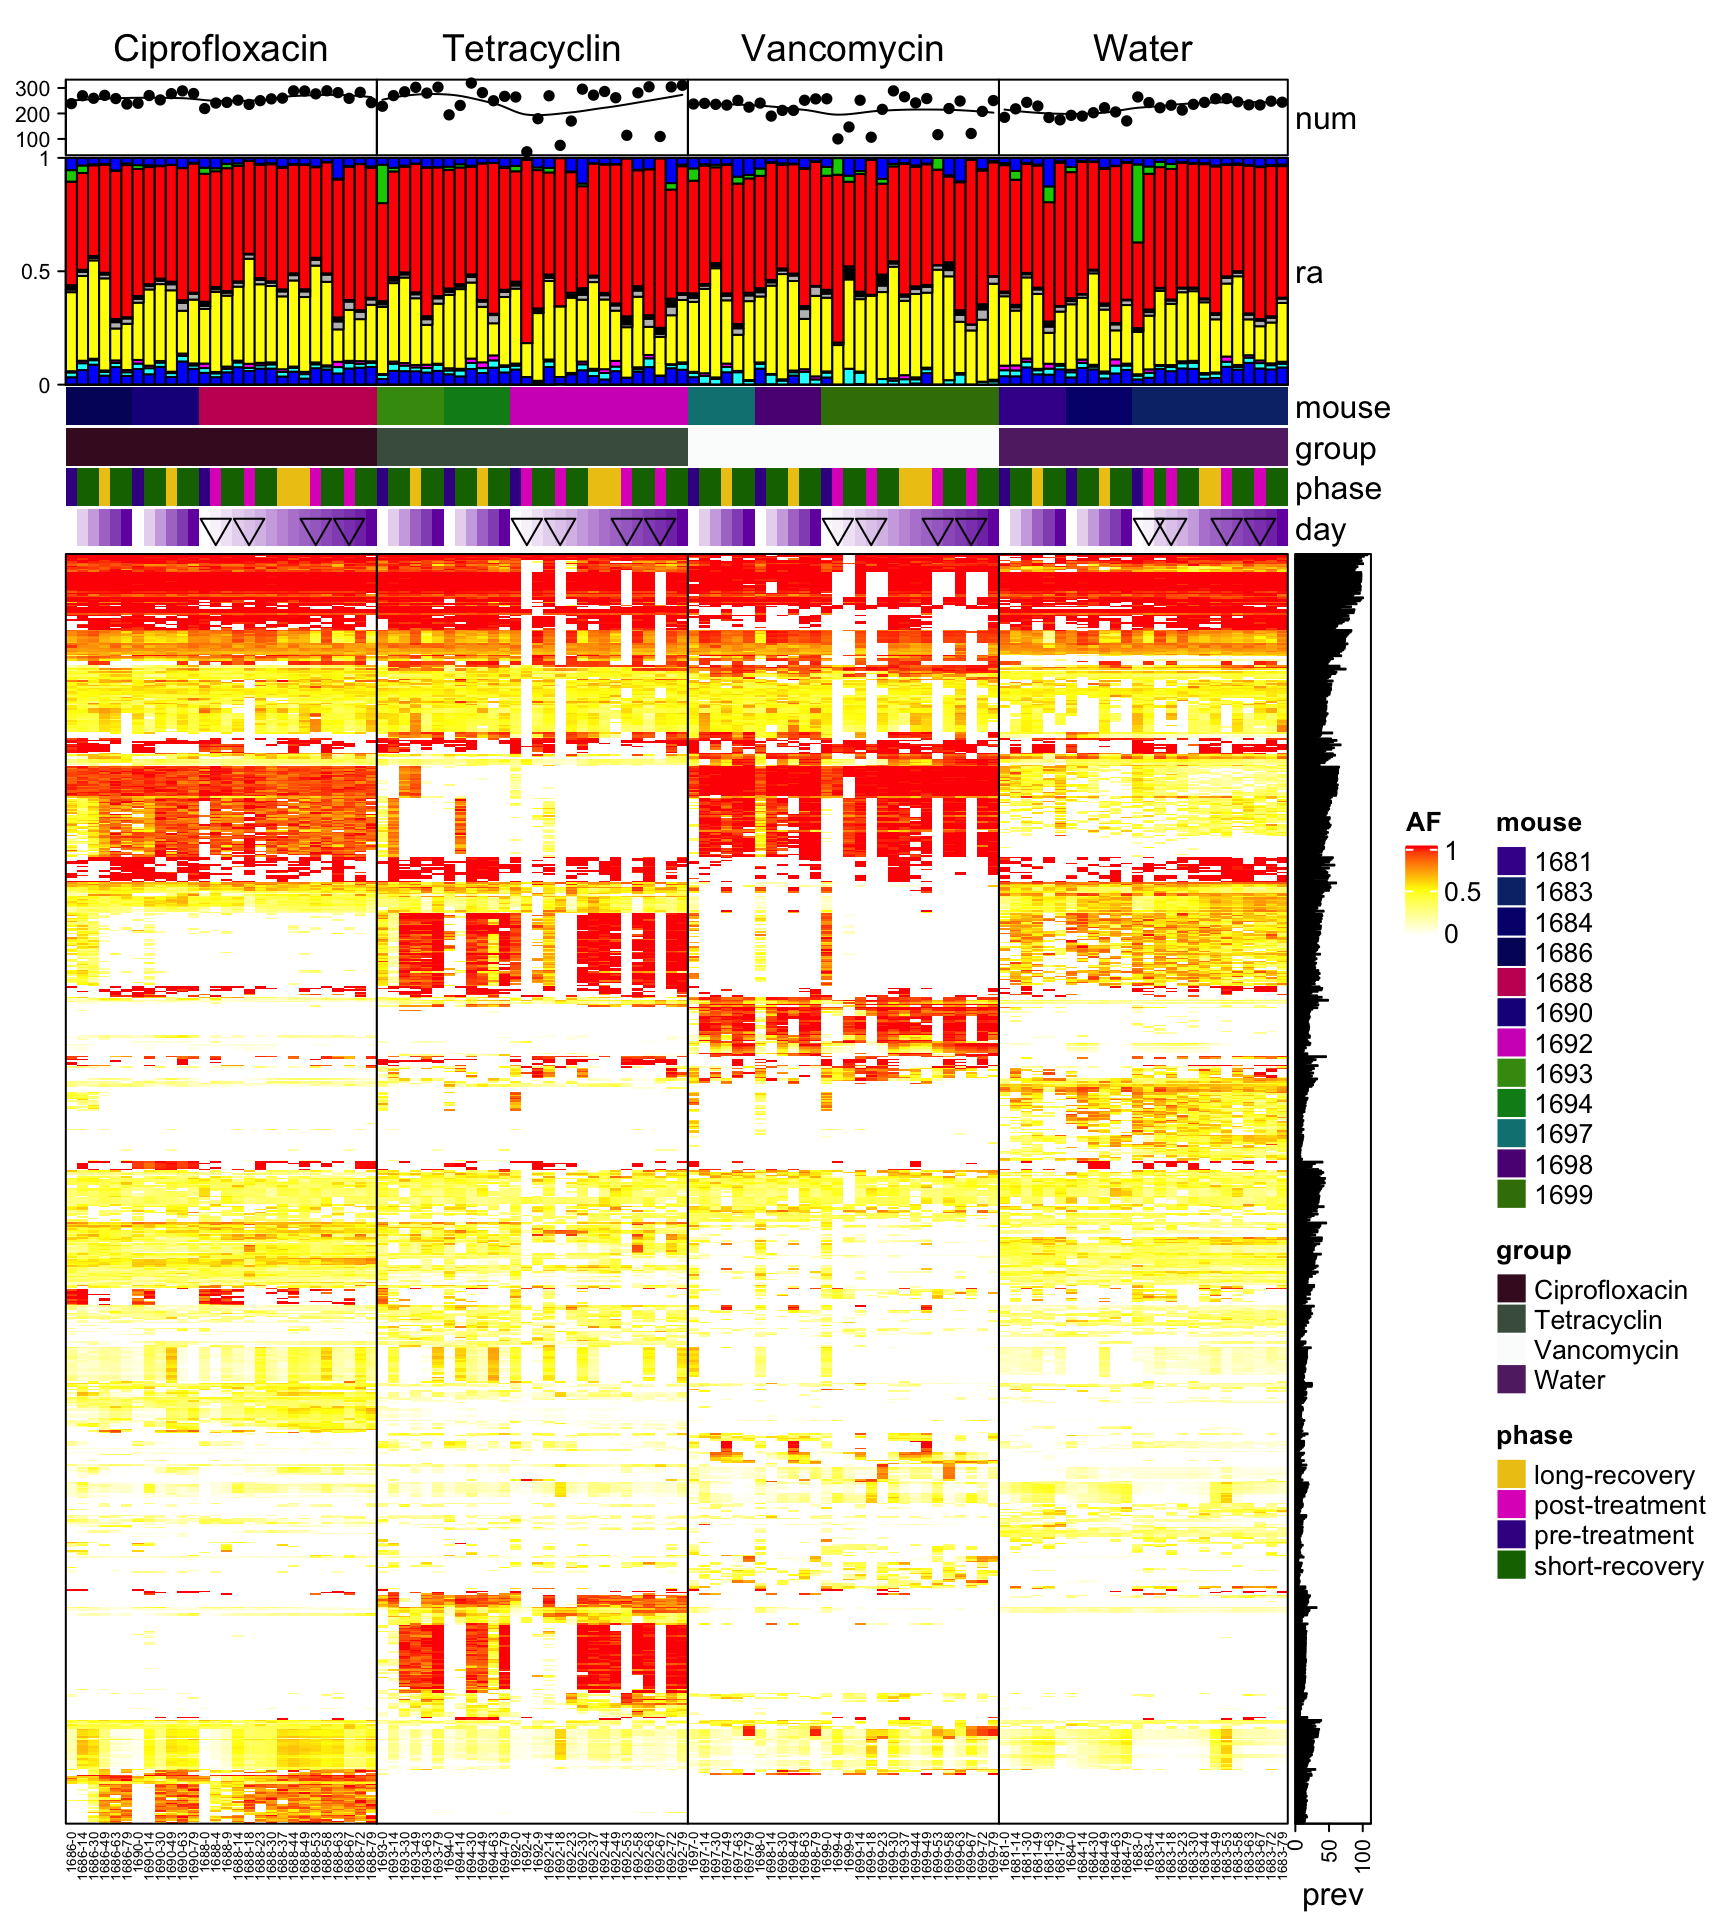
4.7 with information if SNP was observed in resequencing
all high-variant
dat <- readRDS("data/rds/omm_ab_with_fixed.rds")
dat$sample.id <- paste0(dat$mouse.id, "-", dat$day)
dat$variant.id <- paste0(dat$genome_hr, "-", dat$fixed, "-", dat$POS, "-", dat$REF, "-", dat$ALT)
data.wide <- dcast(dat, variant.id ~ sample.id, value.var = "AF")## Warning in dcast(dat, variant.id ~ sample.id, value.var = "AF"): The dcast generic
## in data.table has been passed a data.frame and will attempt to redirect to the
## reshape2::dcast; please note that reshape2 is deprecated, and this redirection is now
## deprecated as well. Please do this redirection yourself like reshape2::dcast(dat). In the
## next version, this warning will become an error.data.wide[is.na(data.wide)] <- 0
rownames(data.wide) <- data.wide$variant.id
data.wide$variant.id <- NULL
library(circlize)
library(ComplexHeatmap)
heat <- data.matrix(data.wide)
# limit to variants that are present in at least 10% of samples
heat_num <- rowSums(heat != 0)
heat2 <- heat[which(heat_num > ncol(heat)/10), ]
# limit to variants that have a high variance
heat_var_num <- matrixStats::rowVars(heat2)
heat3 <- heat2[which(heat_var_num > quantile(heat_var_num, 0.5)), ]
dat$dummy <- 1
annot.data <- aggregate(dummy ~ mouse.id + mouse.group + day + phase, dat, sum)
annot.data$sample.id <- paste0(annot.data$mouse.id, "-", annot.data$day)
heat3.mouse.id <- annot.data[match(colnames(heat3), annot.data$sample.id), ]$mouse.id
heat3.day <- annot.data[match(colnames(heat3), annot.data$sample.id), ]$day
heat3.mouse.group <- annot.data[match(colnames(heat3), annot.data$sample.id), ]$mouse.group
heat3.phase <- annot.data[match(colnames(heat3), annot.data$sample.id), ]$phase
heat3.phase2 <- ifelse(heat3.phase == "post-treatment", 6, NA)
ord = data.frame(day = heat3.day, mouse.id = heat3.mouse.id)
occ = as.data.frame(table(heat3.mouse.id))
ord$occ <- occ[match(ord$mouse.id, occ$heat3.mouse.id), ]$Freq
data.wide.sub <- dat[match(colnames(heat3), dat$sample.id), ]
col_fun = colorRamp2(c(0, 0.5, 1), c("white", "yellow", "red"))
qpcr <- read.table("qpcr.csv", header = T, sep = ";")
qpcr$universal <- NULL
rownames(qpcr) <- paste0(qpcr$mouse, "-", qpcr$day)
qpcr <- qpcr[, -c(1:5)]
qpcr <- apply(qpcr, 1, function(x) x/sum(x))
qpcr <- qpcr[, which(colnames(qpcr) %in% colnames(heat3))]
qpcr <- qpcr[, match(colnames(heat3), colnames(qpcr))]
bug <- sapply(strsplit(rownames(heat3), split = "-", fixed = TRUE), `[`, 1)
fixed <- sapply(strsplit(rownames(heat3), split = "-", fixed = TRUE), `[`, 2)
pdf("heat.pdf", width = 10, height = 10)
Heatmap(heat3, name = "AF", col = col_fun, border = TRUE, top_annotation = HeatmapAnnotation(num = anno_lines(colSums(heat3),
smooth = TRUE, border = TRUE), ra = anno_barplot(t(qpcr), bar_width = 1, gp = gpar(fill = 1:12),
height = unit(3, "cm")), mouse = heat3.mouse.id, group = heat3.mouse.group, phase = heat3.phase,
day = anno_simple(heat3.day, pch = heat3.phase2)), cluster_columns = F, column_order = order(ord$occ,
ord$mouse.id, ord$day), right_annotation = rowAnnotation(fixed = fixed, bug = bug, prev = anno_barplot(rowSums(heat3)),
col = bugcolors), row_gap = unit(0, "mm"), column_gap = unit(0, "mm"), column_split = heat3.mouse.group,
column_names_gp = gpar(fontsize = 5), row_names_gp = gpar(fontsize = 3), show_row_dend = F,
show_row_names = F, show_column_dend = F)
dev.off()## quartz_off_screen
## 2All that are fixed
dat <- readRDS("data/rds/omm_ab_with_fixed.rds")
dat <- dat[which(dat$fixed == TRUE),]
dat$sample.id <- paste0(dat$mouse.id, "-",dat$day)
dat$variant.id <- paste0(dat$genome_hr,"-", dat$fixed, "-", dat$POS, "-", dat$REF, "-", dat$ALT)
data.wide <- dcast(dat, variant.id ~ sample.id, value.var = "AF")
data.wide[is.na(data.wide)] <- 0
rownames(data.wide) <- data.wide$variant.id
data.wide$variant.id <- NULL
library(circlize)
library(ComplexHeatmap)
heat <- data.matrix(data.wide)
# limit to variants that are present in at least 10% of samples
heat_num <- rowSums(heat != 0)
heat2 <- heat[which(heat_num > ncol(heat)/10),]
# limit to variants that have a high variance
heat_var_num <- matrixStats::rowVars(heat2)
heat3 <- heat2[which(heat_var_num > quantile(heat_var_num, 0.5)) ,]
heat3 <- heat
dat$dummy <- 1
annot.data <- aggregate(dummy ~ mouse.id + mouse.group + day + phase, dat, sum)
annot.data$sample.id <- paste0(annot.data$mouse.id, "-",annot.data$day)
heat3.mouse.id <- annot.data[match(colnames(heat3), annot.data$sample.id),]$mouse.id
heat3.day <- annot.data[match(colnames(heat3), annot.data$sample.id),]$day
heat3.mouse.group <- annot.data[match(colnames(heat3), annot.data$sample.id),]$mouse.group
heat3.phase <- annot.data[match(colnames(heat3), annot.data$sample.id),]$phase
heat3.phase2 <- ifelse(heat3.phase == "post-treatment", 6, NA)
ord = data.frame(day = heat3.day, mouse.id =heat3.mouse.id )
occ = as.data.frame(table(heat3.mouse.id))
ord$occ <- occ[match(ord$mouse.id, occ$heat3.mouse.id),]$Freq
data.wide.sub <- dat[match(colnames(heat3), dat$sample.id),]
col_fun = colorRamp2(c(0, 0.5, 1), c("white", "yellow", "red"))
qpcr <- read.table("qpcr.csv", header = T, sep = ";")
qpcr$universal <- NULL
rownames(qpcr) <- paste0(qpcr$mouse, "-",qpcr$day)
qpcr <- qpcr[,-c(1:5)]
qpcr <- apply(qpcr, 1, function(x) x/sum(x))
qpcr <- qpcr[,which(colnames(qpcr) %in% colnames(heat3))]
qpcr <- qpcr[,match(colnames(heat3), colnames(qpcr))]
bug <- sapply(strsplit(rownames(heat3), split='-', fixed=TRUE), `[`, 1)
fixed <- sapply(strsplit(rownames(heat3), split='-', fixed=TRUE), `[`, 2)
Heatmap(heat3, name = "AF", col = col_fun, border = TRUE,
column_order = order(ord$occ, ord$mouse.id, ord$day),cluster_columns =F,
right_annotation = rowAnnotation(fixed = fixed, bug = bug, prev = anno_barplot(rowSums(heat3)), col = bugcolors),
row_gap = unit(0, "mm"), column_gap = unit(0, "mm"),
top_annotation = HeatmapAnnotation(num = anno_lines(colSums(heat3),
smooth = TRUE,border = TRUE), ra = anno_barplot(t(qpcr),
bar_width = 1,gp = gpar(fill = 1:12), height = unit(3, "cm")),
mouse = heat3.mouse.id,
group = heat3.mouse.group,
phase = heat3.phase,
day=anno_simple(heat3.day, pch =heat3.phase2)),
column_names_gp = gpar(fontsize =5),
row_names_gp = gpar(fontsize = 3),
show_row_dend = F,
show_row_names = F,
show_column_dend = F
)All mice clustered
dat <- readRDS("data/rds/omm_ab.rds")
dat$sample.id <- paste0(dat$mouse.id, "-", dat$day)
dat$variant.id <- paste0(dat$POS, "-", dat$REF, "-", dat$ALT)
data.wide <- dcast(dat, variant.id ~ sample.id, value.var = "AF")## Warning in dcast(dat, variant.id ~ sample.id, value.var = "AF"): The dcast generic
## in data.table has been passed a data.frame and will attempt to redirect to the
## reshape2::dcast; please note that reshape2 is deprecated, and this redirection is now
## deprecated as well. Please do this redirection yourself like reshape2::dcast(dat). In the
## next version, this warning will become an error.data.wide[is.na(data.wide)] <- 0
rownames(data.wide) <- data.wide$variant.id
data.wide$variant.id <- NULL
library(circlize)
library(ComplexHeatmap)
heat <- data.matrix(data.wide)
# limit to variants that are present in at least 10% of samples
heat_num <- rowSums(heat != 0)
heat2 <- heat[which(heat_num > ncol(heat)/10), ]
# limit to variants that have a high variance
heat_var_num <- matrixStats::rowVars(heat2)
heat3 <- heat2[which(heat_var_num > quantile(heat_var_num, 0.5)), ]
dat$dummy <- 1
annot.data <- aggregate(dummy ~ mouse.id + mouse.group + day + phase, dat, sum)
annot.data$sample.id <- paste0(annot.data$mouse.id, "-", annot.data$day)
heat3.mouse.id <- annot.data[match(colnames(heat3), annot.data$sample.id), ]$mouse.id
heat3.day <- annot.data[match(colnames(heat3), annot.data$sample.id), ]$day
heat3.mouse.group <- annot.data[match(colnames(heat3), annot.data$sample.id), ]$mouse.group
heat3.phase <- annot.data[match(colnames(heat3), annot.data$sample.id), ]$phase
heat3.phase2 <- ifelse(heat3.phase == "post-treatment", 6, NA)
ord = data.frame(day = heat3.day, mouse.id = heat3.mouse.id)
occ = as.data.frame(table(heat3.mouse.id))
ord$occ <- occ[match(ord$mouse.id, occ$heat3.mouse.id), ]$Freq
data.wide.sub <- dat[match(colnames(heat3), dat$sample.id), ]
col_fun = colorRamp2(c(0, 0.5, 1), c("white", "yellow", "red"))
qpcr <- read.table("qpcr.csv", header = T, sep = ";")
qpcr$universal <- NULL
rownames(qpcr) <- paste0(qpcr$mouse, "-", qpcr$day)
qpcr <- qpcr[, -c(1:5)]
qpcr <- apply(qpcr, 1, function(x) x/sum(x))
qpcr <- qpcr[, which(colnames(qpcr) %in% colnames(heat3))]
qpcr <- qpcr[, match(colnames(heat3), colnames(qpcr))]
# pdf('heat.pdf', width= 10, height = 10)
Heatmap(heat3, name = "AF", col = col_fun, border = TRUE, top_annotation = HeatmapAnnotation(num = anno_lines(colSums(heat3),
smooth = TRUE, border = TRUE), ra = anno_barplot(t(qpcr), bar_width = 1, gp = gpar(fill = 1:12),
height = unit(3, "cm")), mouse = heat3.mouse.id, group = heat3.mouse.group, phase = heat3.phase,
day = anno_simple(heat3.day, pch = heat3.phase2)), cluster_columns = T, right_annotation = rowAnnotation(prev = anno_barplot(rowSums(heat3))),
row_gap = unit(0, "mm"), column_gap = unit(0, "mm"), column_names_gp = gpar(fontsize = 5),
row_names_gp = gpar(fontsize = 3), show_row_dend = F, show_row_names = F, show_column_dend = T)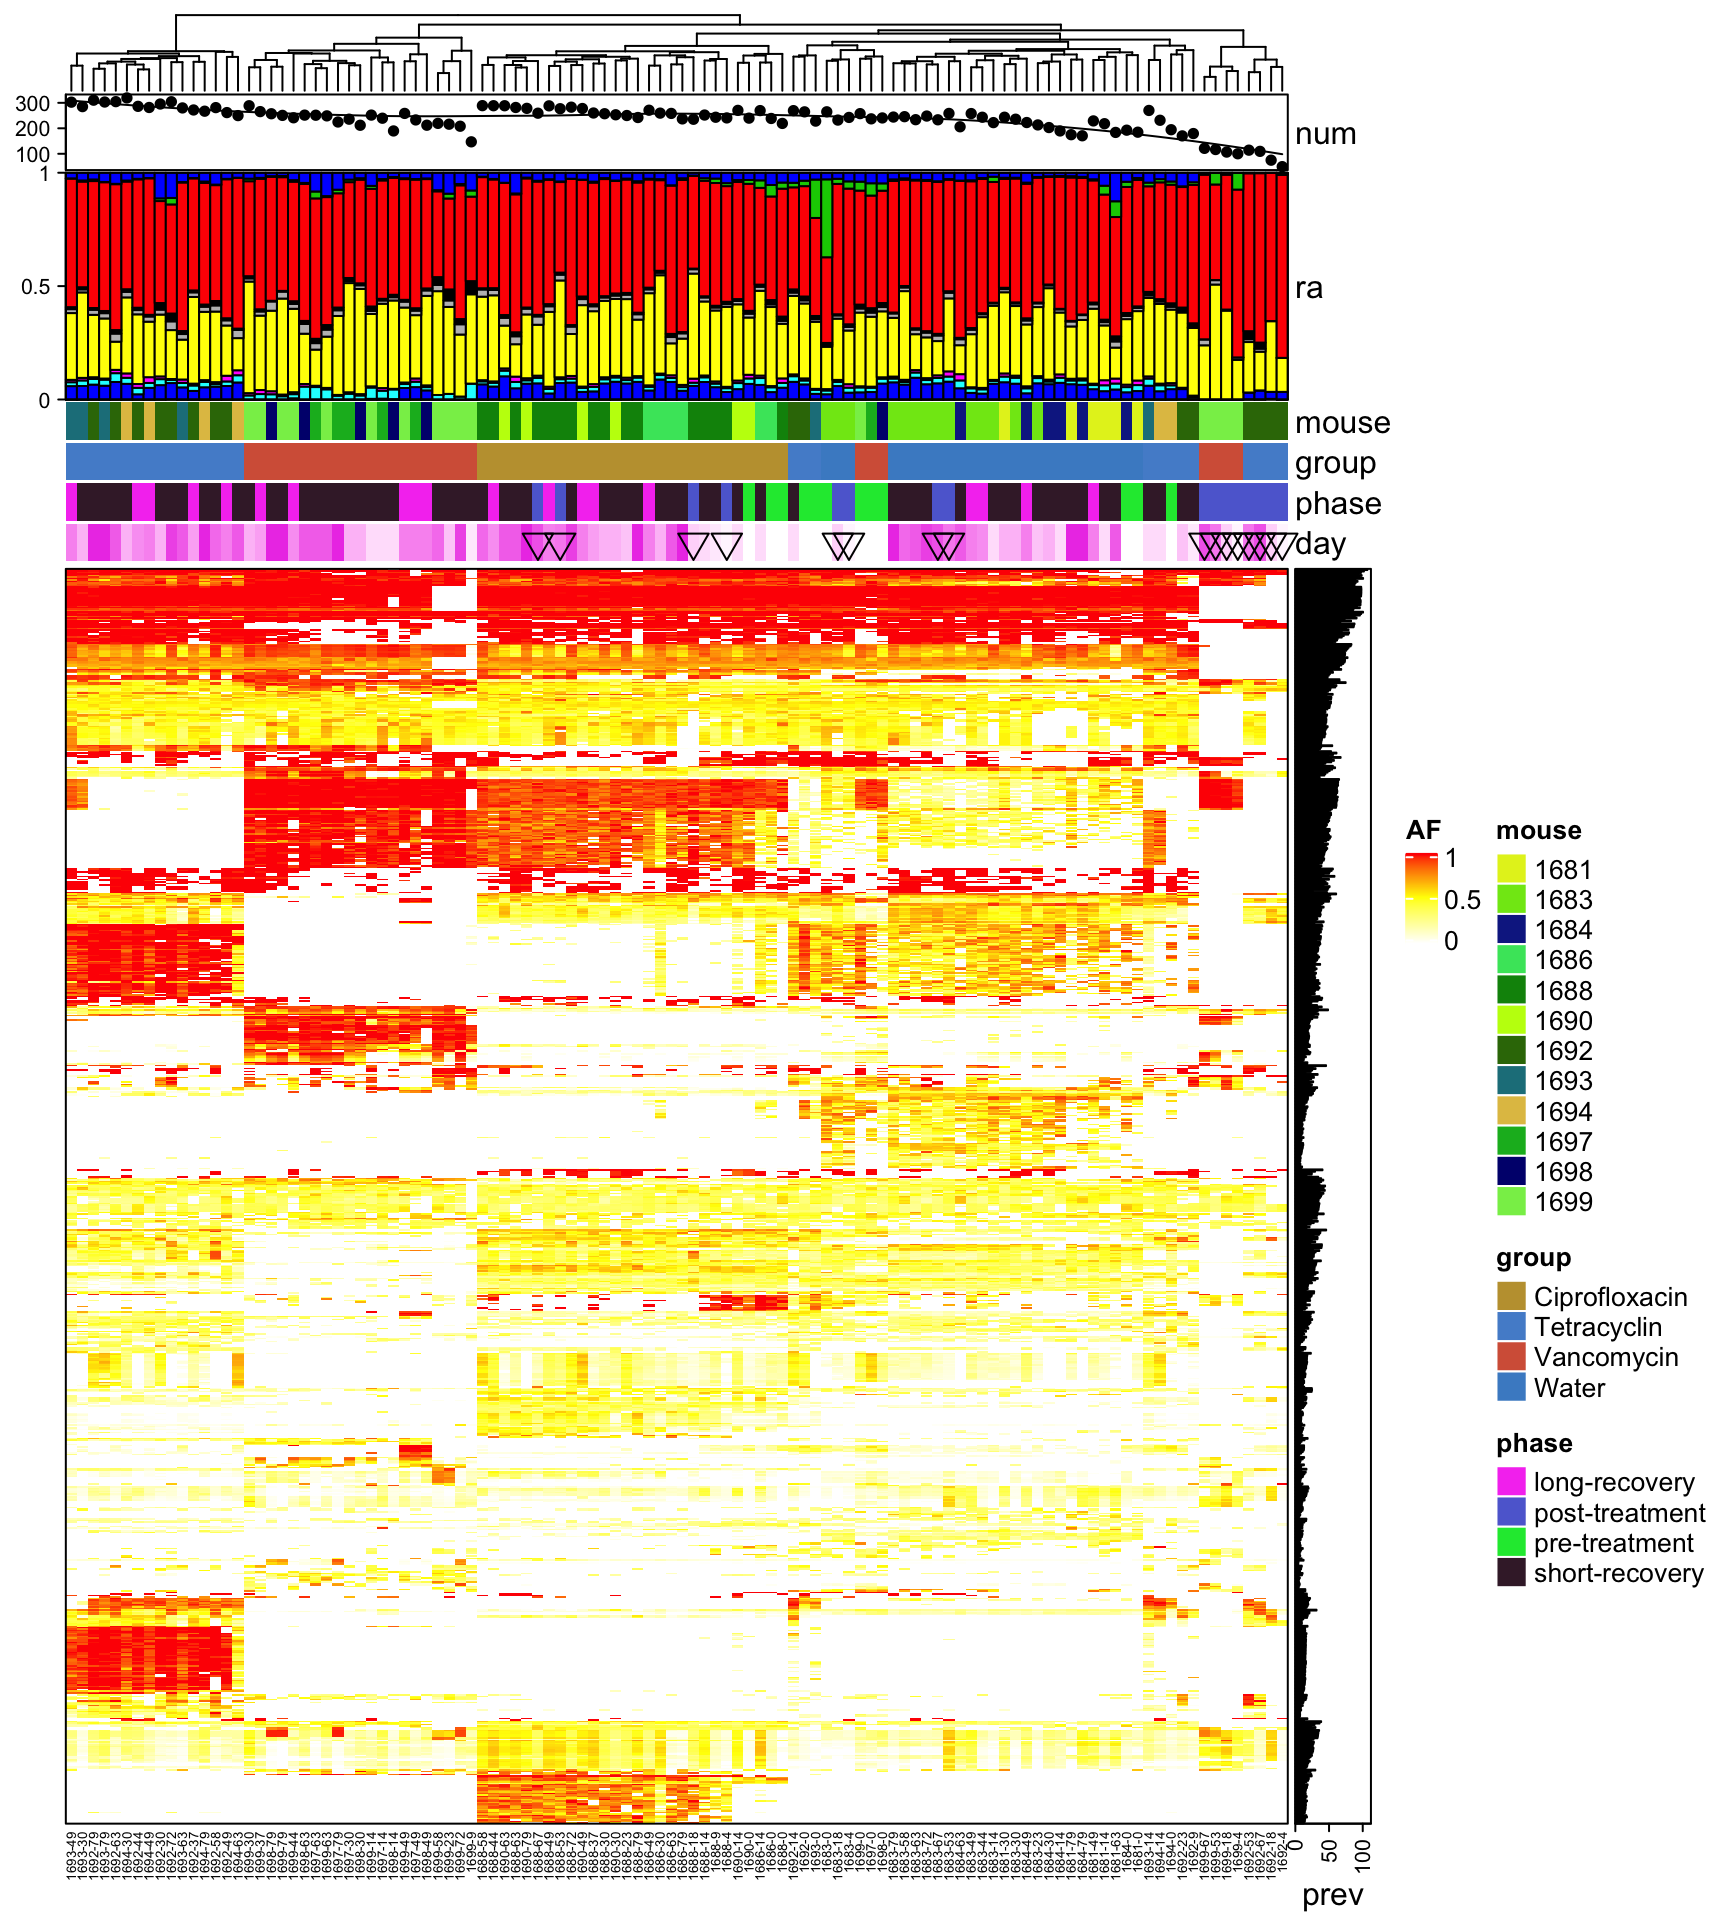
dat <- readRDS("data/rds/omm_ab.rds")
dat$sample.id <- paste0(dat$mouse.id, "-", dat$day)
dat$variant.id <- paste0(dat$POS, "-", dat$REF, "-", dat$ALT)
data.wide <- dcast(dat, variant.id ~ sample.id, value.var = "AF")## Warning in dcast(dat, variant.id ~ sample.id, value.var = "AF"): The dcast generic
## in data.table has been passed a data.frame and will attempt to redirect to the
## reshape2::dcast; please note that reshape2 is deprecated, and this redirection is now
## deprecated as well. Please do this redirection yourself like reshape2::dcast(dat). In the
## next version, this warning will become an error.data.wide[is.na(data.wide)] <- 0
rownames(data.wide) <- data.wide$variant.id
data.wide$variant.id <- NULL
library(circlize)
library(ComplexHeatmap)
heat <- data.matrix(data.wide)
# limit to variants that are present in at least 10% of samples
heat_num <- rowSums(heat != 0)
heat2 <- heat[which(heat_num > ncol(heat)/10), ]
# limit to variants that have a high variance
heat_var_num <- matrixStats::rowVars(heat2)
heat3 <- heat2[which(heat_var_num > quantile(heat_var_num, 0.5)), ]
dat$dummy <- 1
annot.data <- aggregate(dummy ~ mouse.id + mouse.group + day + phase, dat, sum)
annot.data$sample.id <- paste0(annot.data$mouse.id, "-", annot.data$day)
heat3.mouse.id <- annot.data[match(colnames(heat3), annot.data$sample.id), ]$mouse.id
heat3.day <- annot.data[match(colnames(heat3), annot.data$sample.id), ]$day
heat3.mouse.group <- annot.data[match(colnames(heat3), annot.data$sample.id), ]$mouse.group
heat3.phase <- annot.data[match(colnames(heat3), annot.data$sample.id), ]$phase
heat3.phase2 <- ifelse(heat3.phase == "post-treatment", 6, NA)
ord = data.frame(day = heat3.day, mouse.id = heat3.mouse.id)
occ = as.data.frame(table(heat3.mouse.id))
ord$occ <- occ[match(ord$mouse.id, occ$heat3.mouse.id), ]$Freq
data.wide.sub <- dat[match(colnames(heat3), dat$sample.id), ]
col_fun = colorRamp2(c(0, 0.5, 1), c("white", "yellow", "red"))
qpcr <- read.table("qpcr.csv", header = T, sep = ";")
qpcr$universal <- NULL
rownames(qpcr) <- paste0(qpcr$mouse, "-", qpcr$day)
qpcr <- qpcr[, -c(1:5)]
qpcr <- t(qpcr)
qpcr <- qpcr[, which(colnames(qpcr) %in% colnames(heat3))]
qpcr <- qpcr[, match(colnames(heat3), colnames(qpcr))]
# pdf('heat.pdf', width= 10, height = 10)
Heatmap(heat3, name = "AF", col = col_fun, border = TRUE, top_annotation = HeatmapAnnotation(num = anno_lines(colSums(heat3),
smooth = TRUE, border = TRUE), ra = anno_barplot(t(qpcr), bar_width = 1, gp = gpar(fill = 1:12),
height = unit(3, "cm")), mouse = heat3.mouse.id, group = heat3.mouse.group, phase = heat3.phase,
day = anno_simple(heat3.day, pch = heat3.phase2)), cluster_columns = T, right_annotation = rowAnnotation(prev = anno_barplot(rowSums(heat3))),
row_gap = unit(0, "mm"), column_gap = unit(0, "mm"), column_names_gp = gpar(fontsize = 5),
row_names_gp = gpar(fontsize = 3), show_row_dend = F, show_row_names = F, show_column_dend = T)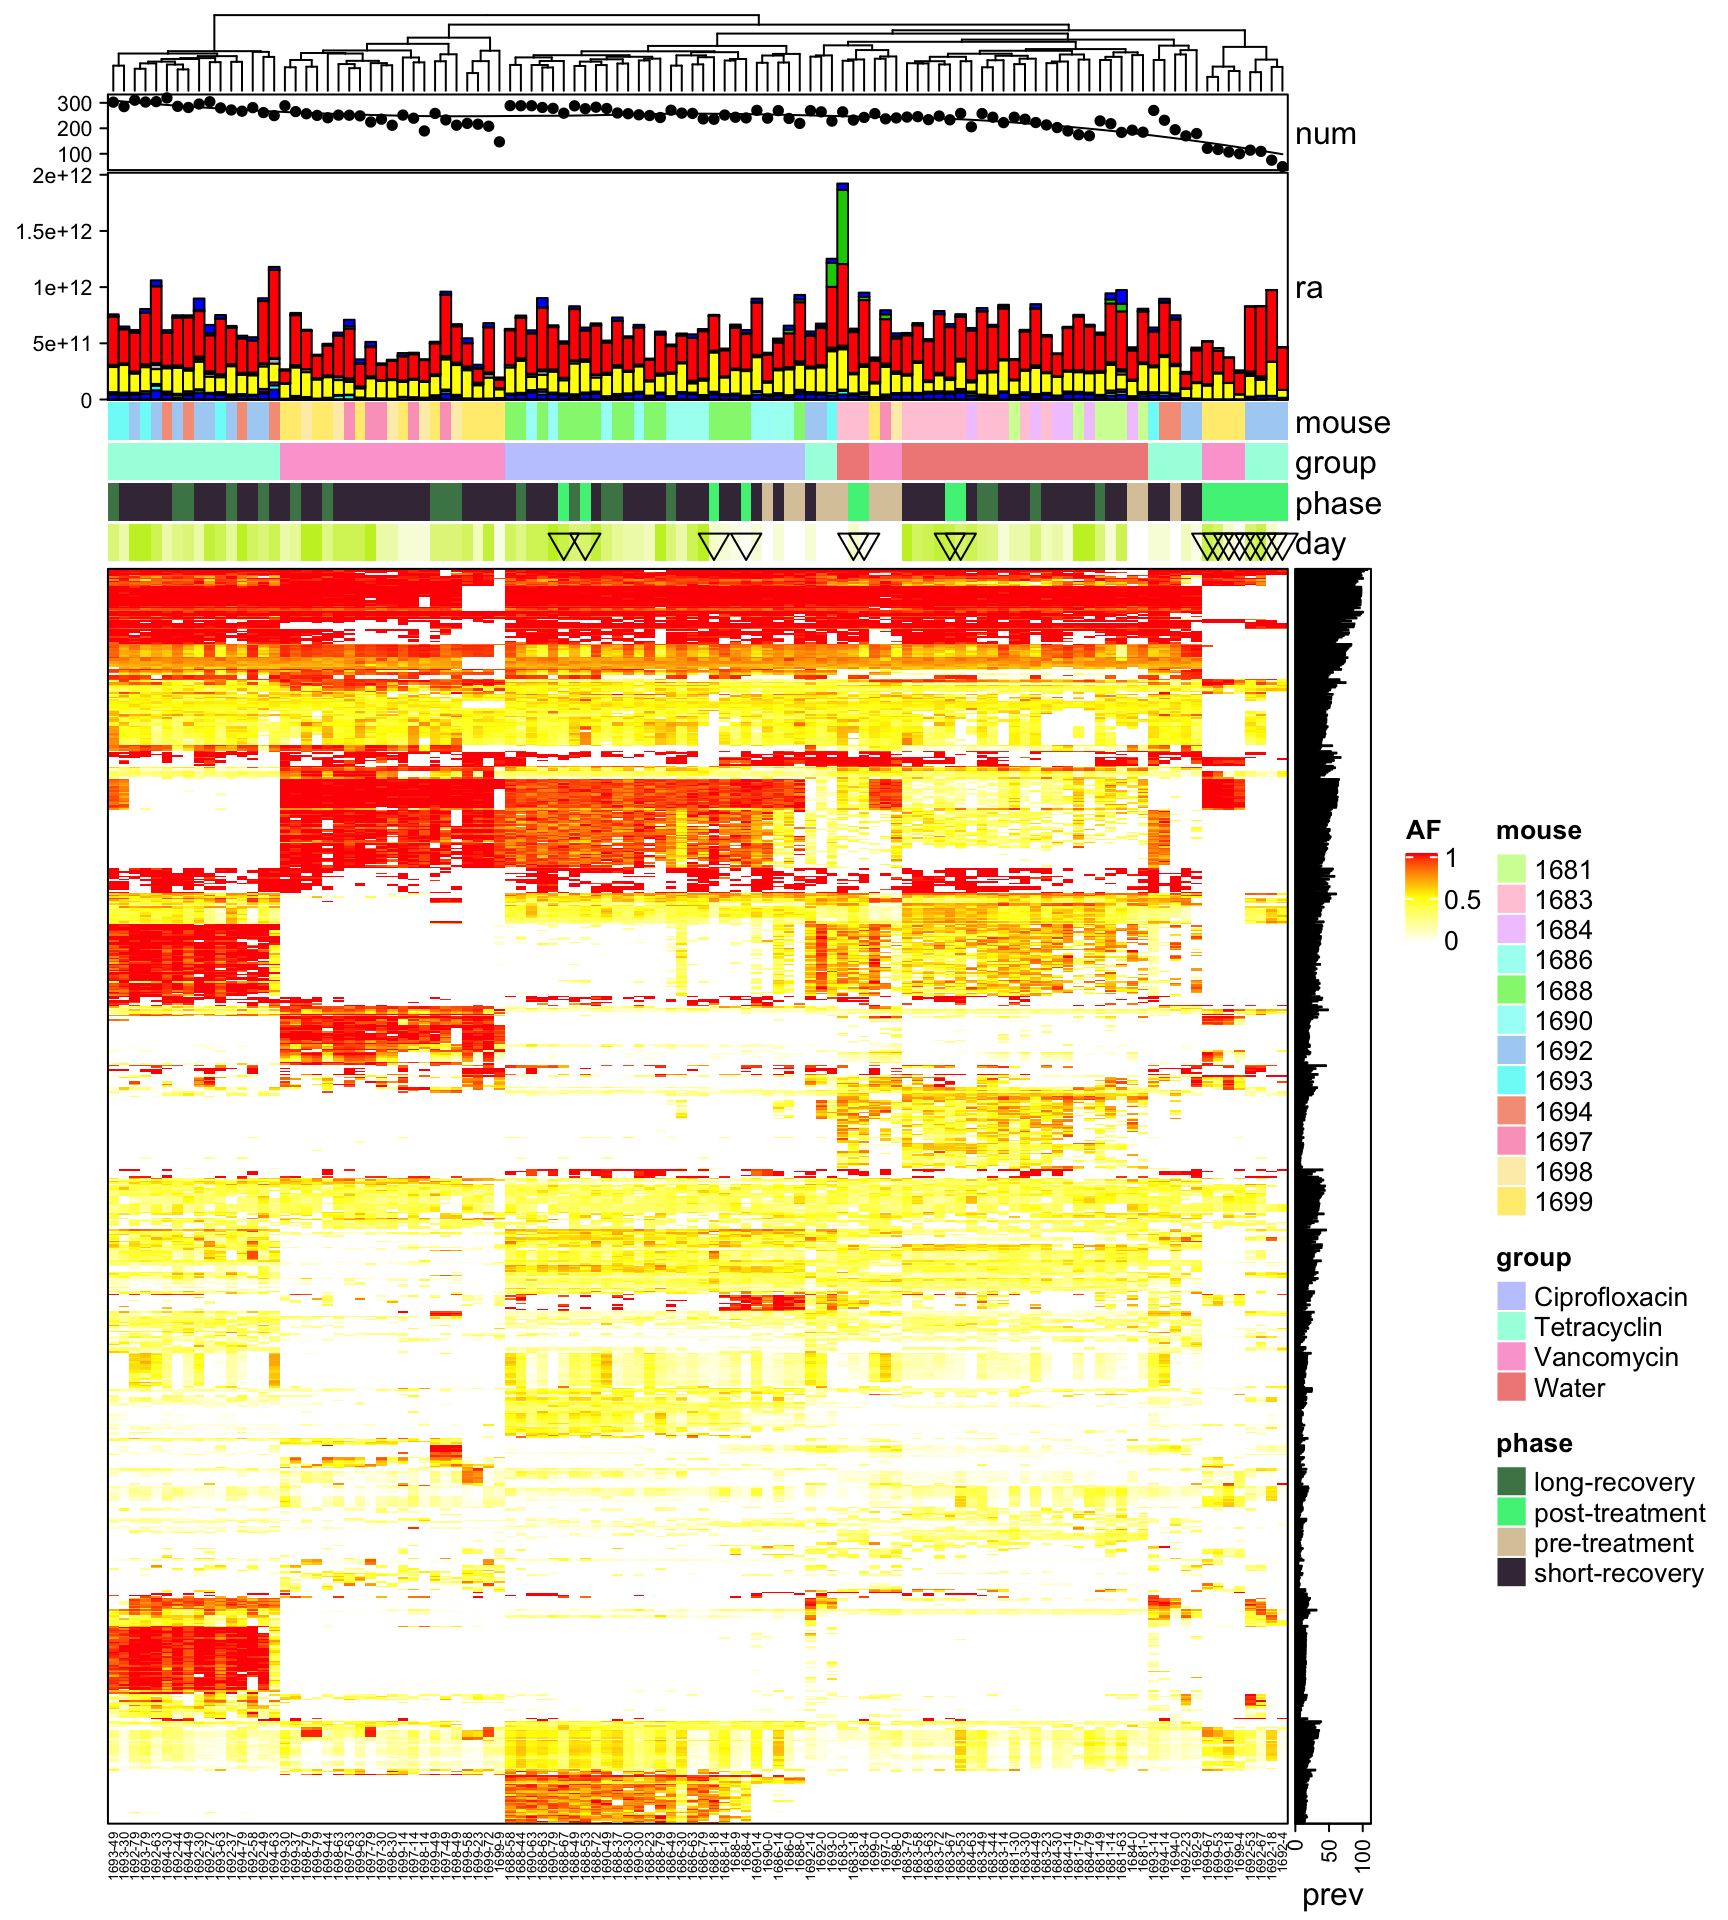
4.8 Focus on mouse where we have many time points
dat <- readRDS("data/rds/omm_ab.rds")
dat$rep.group <- translateMouseIdToReplicateGroup(dat$mouse.id)
dat <- dat[which(dat$rep.group == "Full"), ]
dat$sample.id <- paste0(dat$mouse.id, "-", dat$day)
dat$variant.id <- paste0(dat$POS, "-", dat$REF, "-", dat$ALT)
data.wide <- dcast(dat, variant.id ~ sample.id, value.var = "AF")## Warning in dcast(dat, variant.id ~ sample.id, value.var = "AF"): The dcast generic
## in data.table has been passed a data.frame and will attempt to redirect to the
## reshape2::dcast; please note that reshape2 is deprecated, and this redirection is now
## deprecated as well. Please do this redirection yourself like reshape2::dcast(dat). In the
## next version, this warning will become an error.data.wide[is.na(data.wide)] <- 0
rownames(data.wide) <- data.wide$variant.id
data.wide$variant.id <- NULL
heat <- data.matrix(data.wide)
# limit to variants that are present in at least 10% of samples
heat_num <- rowSums(heat != 0)
heat2 <- heat[which(heat_num > ncol(heat)/10), ]
# limit to variants that have a high variance
heat_var_num <- matrixStats::rowVars(heat2)
heat3 <- heat2[which(heat_var_num > quantile(heat_var_num, 0.5)), ]
dat$dummy <- 1
annot.data <- aggregate(dummy ~ mouse.id + mouse.group + day + phase, dat, sum)
annot.data$sample.id <- paste0(annot.data$mouse.id, "-", annot.data$day)
heat3.mouse.id <- annot.data[match(colnames(heat3), annot.data$sample.id), ]$mouse.id
heat3.day <- annot.data[match(colnames(heat3), annot.data$sample.id), ]$day
ord = data.frame(day = heat3.day, mouse.id = heat3.mouse.id)
heat3.mouse.group <- annot.data[match(colnames(heat3), annot.data$sample.id), ]$mouse.group
heat3.phase <- annot.data[match(colnames(heat3), annot.data$sample.id), ]$phase
heat3.phase2 <- ifelse(heat3.phase == "post-treatment", 6, NA)
col_fun = colorRamp2(c(0, 0.5, 1), c("white", "yellow", "red"))
# order the heatmap by treatment group
Heatmap(heat3, name = "AF", col = col_fun, border = TRUE, top_annotation = HeatmapAnnotation(num = anno_lines(colSums(heat3),
smooth = TRUE, border = TRUE), day = anno_simple(heat3.day, pch = heat3.phase2)), cluster_columns = F,
column_order = order(ord$mouse.id, ord$day), column_split = heat3.mouse.group, column_names_gp = gpar(fontsize = 5),
row_names_gp = gpar(fontsize = 8), show_row_dend = F, show_row_names = F, show_column_dend = F)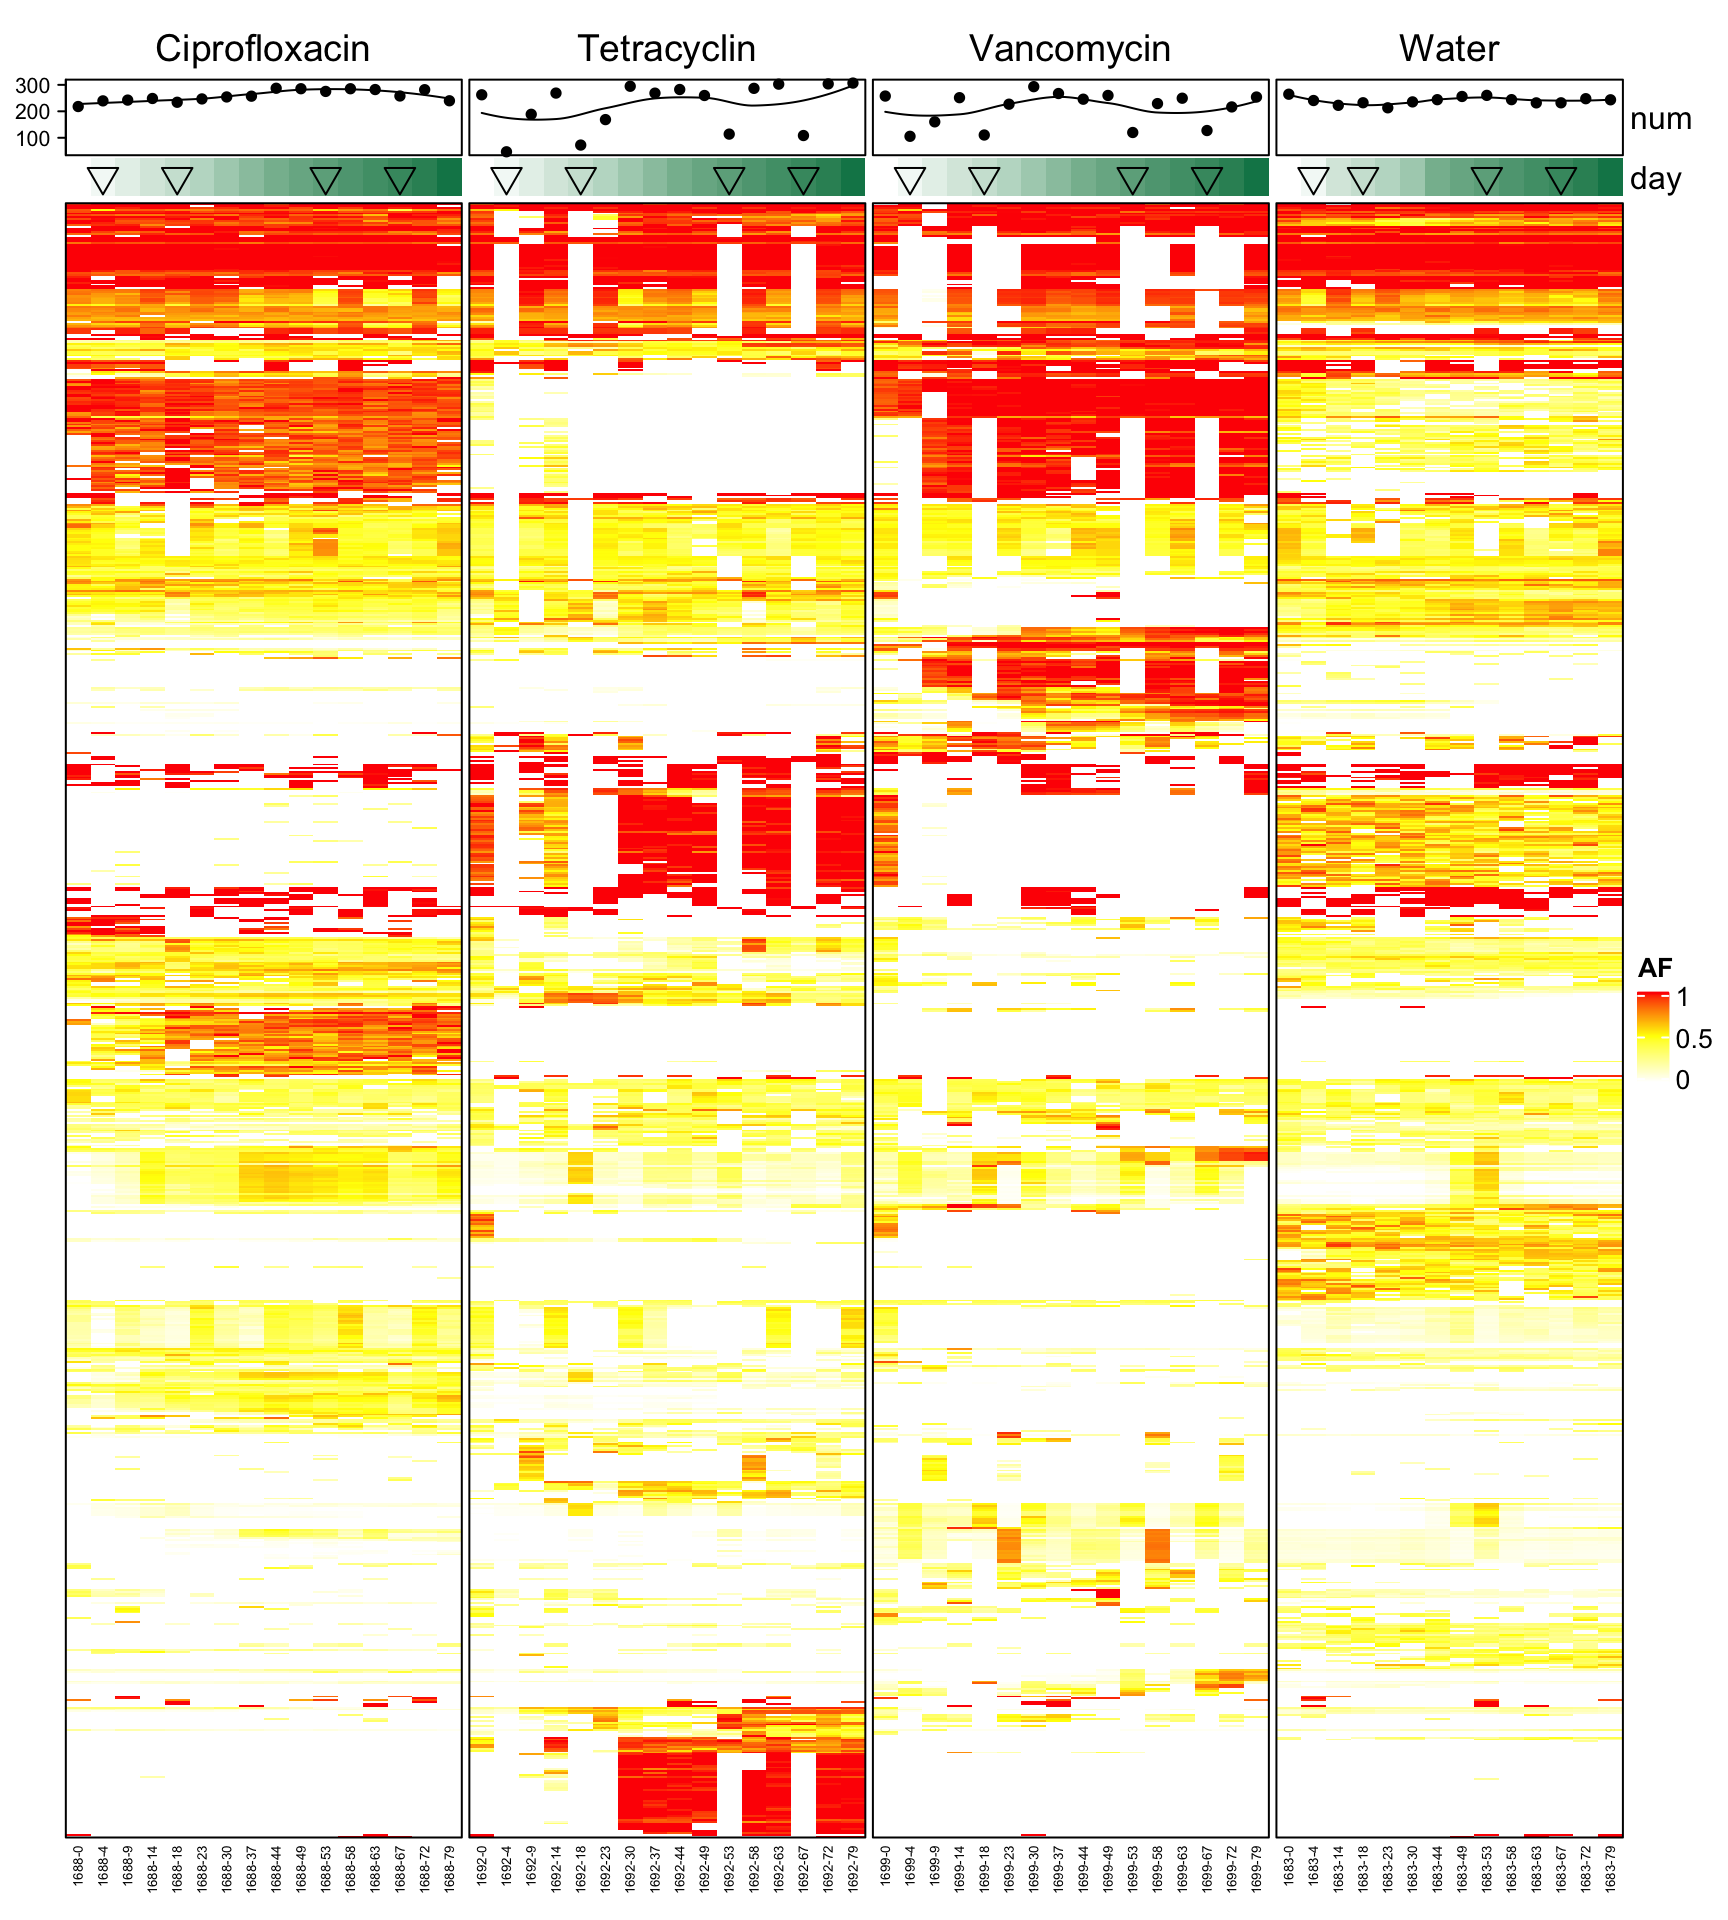
4.9 Akkermansia Muciniphila
4.9.1 area plot 1
dat <- readRDS("data/rds/omm_ab.rds")
dat$variant.id <- paste0(dat$POS, "-", dat$REF, "-", dat$ALT)
dat <- dat[which(dat$chr == "Akkermansia_muciniphila"), ]
data.wide <- dcast(dat, day + mouse.id + mouse.group ~ variant.id, value.var = "AF")## Warning in dcast(dat, day + mouse.id + mouse.group ~ variant.id, value.var = "AF"): The
## dcast generic in data.table has been passed a data.frame and will attempt to redirect to
## the reshape2::dcast; please note that reshape2 is deprecated, and this redirection is now
## deprecated as well. Please do this redirection yourself like reshape2::dcast(dat). In the
## next version, this warning will become an error.data.wide[is.na(data.wide)] <- 0
colMax <- function(X) apply(X, 2, max)
dat_mat <- data.wide[, -c(1:3)]
# filter variants
data.wide.reduced <- cbind(data.wide[, c(1:3)], dat_mat[, which(colMax(dat_mat) > 0.5)])
# data.wide.reduced <- data.wide
dat2 <- melt(data.wide.reduced, id.vars = c("day", "mouse.id", "mouse.group"))## Warning in melt(data.wide.reduced, id.vars = c("day", "mouse.id", "mouse.group")): The
## melt generic in data.table has been passed a data.frame and will attempt to redirect
## to the relevant reshape2 method; please note that reshape2 is deprecated, and this
## redirection is now deprecated as well. To continue using melt methods from reshape2
## while both libraries are attached, e.g. melt.list, you can prepend the namespace like
## reshape2::melt(data.wide.reduced). In the next version, this warning will become an error.dat3 <- dat2 %>% group_by(day, mouse.id) %>% mutate(Nor = value/sum(value))
set.seed(123)
col_list <- sort(unique(dat3$variable))
cols <- randomcoloR::randomColor(length(unique(dat3$variable)))
# Muller plot
p <- ggplot(dat3, aes(x = day, y = Nor, group = variable, fill = variable, label = ))
p <- p + geom_area(color = "black", size = 0.1)
p <- p + facet_wrap(~mouse.group + mouse.id, ncol = 3)
p <- p + theme_minimal() + theme(legend.position = "none")
p <- p + ylab("Fraction")
p <- p + scale_fill_manual(values = cols, breaks = col_list)
p <- p + geom_vline(xintercept = c(4, 18, 53, 67))
plotly::ggplotly(p)4.9.2 line plot
dat <- readRDS("data/rds/omm_ab.rds")
dat$variant.id <- paste0(dat$POS, "-", dat$REF, "-", dat$ALT)
dat <- dat[which(dat$chr == "Akkermansia_muciniphila"), ]
data.wide <- dcast(dat, day + mouse.id + mouse.group ~ variant.id, value.var = "AF")## Warning in dcast(dat, day + mouse.id + mouse.group ~ variant.id, value.var = "AF"): The
## dcast generic in data.table has been passed a data.frame and will attempt to redirect to
## the reshape2::dcast; please note that reshape2 is deprecated, and this redirection is now
## deprecated as well. Please do this redirection yourself like reshape2::dcast(dat). In the
## next version, this warning will become an error.data.wide[is.na(data.wide)] <- 0
dat2 <- melt(data.wide, id.vars = c("day", "mouse.id", "mouse.group"))## Warning in melt(data.wide, id.vars = c("day", "mouse.id", "mouse.group")): The melt generic
## in data.table has been passed a data.frame and will attempt to redirect to the relevant
## reshape2 method; please note that reshape2 is deprecated, and this redirection is now
## deprecated as well. To continue using melt methods from reshape2 while both libraries are
## attached, e.g. melt.list, you can prepend the namespace like reshape2::melt(data.wide). In
## the next version, this warning will become an error.set.seed(123)
col_list <- sort(unique(dat3$variable))
cols <- randomcoloR::randomColor(length(unique(dat3$variable)))
p <- ggplot(dat2, aes(x = day, y = value))
p <- p + geom_line(aes(group = variable), alpha = 0.2)
p <- p + theme_minimal()
p <- p + facet_wrap(~mouse.group + mouse.id, ncol = 3)
p <- p + geom_vline(xintercept = c(4, 18, 53, 67))
plotly::ggplotly(p)4.10 dendogram
library(circlize)
library(ComplexHeatmap)
dat <- readRDS("data/rds/omm_ab_with_fixed.rds")
dat$rep.group <- translateMouseIdToReplicateGroup(dat$mouse.id)
dat <- dat[which(dat$rep.group == "Full"), ]
dat$sample.id <- paste0(dat$mouse.id, "-", dat$day)
dat$variant.id <- paste0(dat$genome_hr, "-", dat$fixed, "-", dat$POS, "-", dat$REF, "-", dat$ALT)
data.wide <- dcast(dat, variant.id ~ sample.id, value.var = "AF")
data.wide[is.na(data.wide)] <- 0
rownames(data.wide) <- data.wide$variant.id
data.wide$variant.id <- NULL
heat <- data.matrix(data.wide)
# limit to variants that are present in at least 10% of samples
heat_num <- rowSums(heat != 0)
# limit to variants that have a high variance
heat2 <- heat
heat_var_num <- matrixStats::rowVars(heat2)
heat3 <- heat
dat$dummy <- 1
annot.data <- aggregate(dummy ~ mouse.id + mouse.group + day + phase, dat, sum)
annot.data$sample.id <- paste0(annot.data$mouse.id, "-", annot.data$day)
heat3.mouse.id <- annot.data[match(colnames(heat3), annot.data$sample.id), ]$mouse.id
heat3.day <- annot.data[match(colnames(heat3), annot.data$sample.id), ]$day
heat3.mouse.group <- annot.data[match(colnames(heat3), annot.data$sample.id), ]$mouse.group
heat3.phase <- annot.data[match(colnames(heat3), annot.data$sample.id), ]$phase
heat3.phase2 <- ifelse(heat3.phase == "post-treatment", 6, NA)
ord = data.frame(day = heat3.day, mouse.id = heat3.mouse.id)
occ = as.data.frame(table(heat3.mouse.id))
ord$occ <- occ[match(ord$mouse.id, occ$heat3.mouse.id), ]$Freq
data.wide.sub <- dat[match(colnames(heat3), dat$sample.id), ]
col_fun = colorRamp2(c(0, 0.5, 1), c("white", "yellow", "red"))
qpcr <- read.table("qpcr.csv", header = T, sep = ";")
qpcr$universal <- NULL
rownames(qpcr) <- paste0(qpcr$mouse, "-", qpcr$day)
qpcr <- qpcr[, -c(1:5)]
qpcr <- apply(qpcr, 1, function(x) x/sum(x))
qpcr <- qpcr[, which(colnames(qpcr) %in% colnames(heat3))]
qpcr <- qpcr[, match(colnames(heat3), colnames(qpcr))]
bug <- sapply(strsplit(rownames(heat3), split = "-", fixed = TRUE), `[`, 1)
fixed <- sapply(strsplit(rownames(heat3), split = "-", fixed = TRUE), `[`, 2)
qpcr_1 <- qpcr[1, ]
qpcr_2 <- qpcr[2, ]
qpcr_3 <- qpcr[3, ]
qpcr_4 <- qpcr[4, ]
qpcr_5 <- qpcr[5, ]
qpcr_6 <- qpcr[6, ]
qpcr_7 <- qpcr[7, ]
qpcr_8 <- qpcr[8, ]
qpcr_9 <- qpcr[9, ]
qpcr_10 <- qpcr[10, ]
qpcr_11 <- qpcr[11, ]
qpcr_12 <- qpcr[12, ]
hc = hclust(dist(t(heat3)))
Heatmap(matrix(nc = ncol(heat3), nr = 0), column_order = order(ord$mouse.id, ord$day), column_split = heat3.mouse.group,
cluster_columns = FALSE, top_annotation = HeatmapAnnotation(day = anno_simple(heat3.day,
pch = heat3.phase2), KB1 = anno_lines(log10(qpcr_1), border = T, add_points = TRUE,
pt_gp = gpar(col = 1), height = unit(0.7, "cm"), axis = F), YL2 = anno_lines(log10(qpcr_2),
border = T, add_points = TRUE, pt_gp = gpar(col = 2), height = unit(0.7, "cm"), axis = F),
KB18 = anno_lines(log10(qpcr_3), border = T, add_points = TRUE, pt_gp = gpar(col = 3),
height = unit(1, "cm"), axis = F), YL27 = anno_lines(log10(qpcr_4), border = T,
add_points = TRUE, pt_gp = gpar(col = 4), height = unit(1, "cm"), axis = F), YL31 = anno_lines(log10(qpcr_5),
border = T, add_points = TRUE, pt_gp = gpar(col = 5), height = unit(1, "cm"), axis = F),
YL32 = anno_lines(log10(qpcr_6), border = T, add_points = TRUE, pt_gp = gpar(col = 6),
height = unit(1, "cm"), axis = F), YL44 = anno_lines(log10(qpcr_7), border = T,
add_points = TRUE, pt_gp = gpar(col = 7), height = unit(1, "cm"), axis = F), YL45 = anno_lines(log10(qpcr_8),
border = TRUE, add_points = TRUE, pt_gp = gpar(col = 8), height = unit(1, "cm"),
axis = F), I46 = anno_lines(log10(qpcr_9), border = TRUE, add_points = TRUE, pt_gp = gpar(col = 9),
height = unit(1, "cm"), axis = F), I48 = anno_lines(log10(qpcr_10), border = TRUE,
add_points = TRUE, pt_gp = gpar(col = 10), height = unit(1, "cm"), axis = F), I49 = anno_lines(log10(qpcr_11),
border = TRUE, add_points = TRUE, pt_gp = gpar(col = 11), height = unit(1, "cm"),
axis = F), YL58 = anno_lines(log10(qpcr_12), border = TRUE, add_points = TRUE, pt_gp = gpar(col = 12),
height = unit(1, "cm"), axis = F), ra = anno_barplot(t(qpcr), bar_width = 1, gp = gpar(fill = 1:12),
height = unit(1.5, "cm"), num = anno_lines(colSums(heat3), smooth = TRUE, border = TRUE))))dat <- readRDS("data/rds/omm_ab_with_fixed.rds")
p <- ggplot(dat, aes(x = POS, y = AF, color = fixed))
p <- p + facet_grid(chr ~ ., space = "free_x") + geom_point(size = 0.1, shape = ".")
p <- p + theme_minimal()
p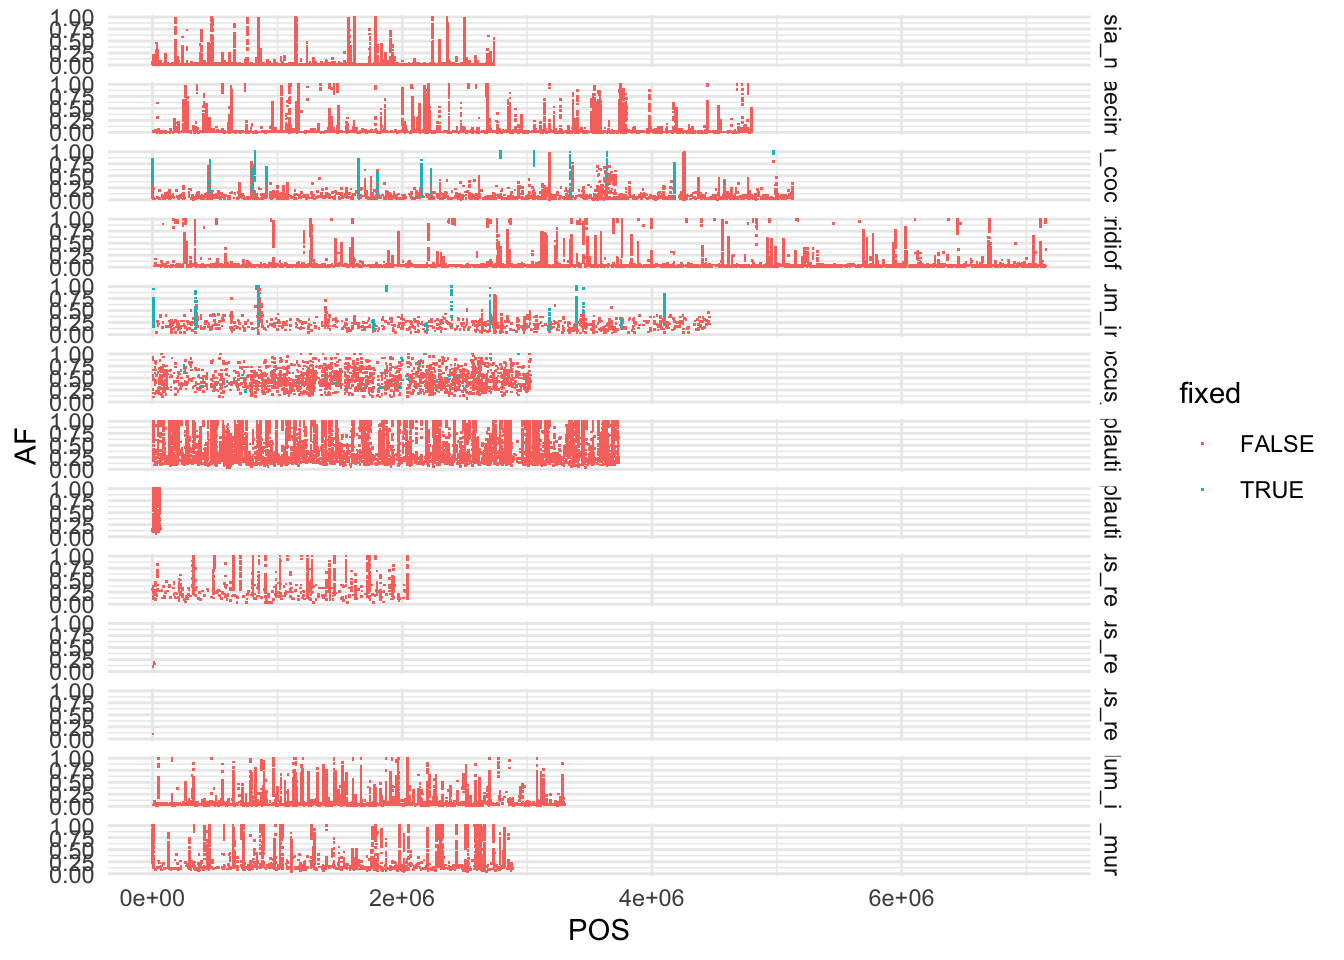
dat <- readRDS("data/rds/omm_ab_with_fixed.rds")
dat2 <- dat[which(dat$fixed == T), ]
dat2.reduced <- data.frame(chr = dat2$chr, POS = dat2$POS)
dat3 <- dat2.reduced[duplicated(dat2.reduced), ]
p <- ggplot(dat, aes(x = POS, y = AF, color = day))
p <- p + facet_wrap(chr ~ ., shrink = F, strip.position = "right", ncol = 1) + geom_point(size = 0.1,
shape = ".")
p <- p + geom_vline(data = dat3, aes(xintercept = POS), color = "red", alpha = 0.2)
p <- p + theme_minimal() + scale_color_viridis_c()
p <- p + theme(strip.background = element_blank(), strip.text.y = element_text(angle = 0, color = "black"),
axis.title.y = element_blank(), axis.text.y = element_blank(), axis.ticks.y = element_blank(),
axis.line.y = element_blank(), panel.border = element_blank(), panel.grid.major = element_blank(),
panel.grid.minor = element_blank())
p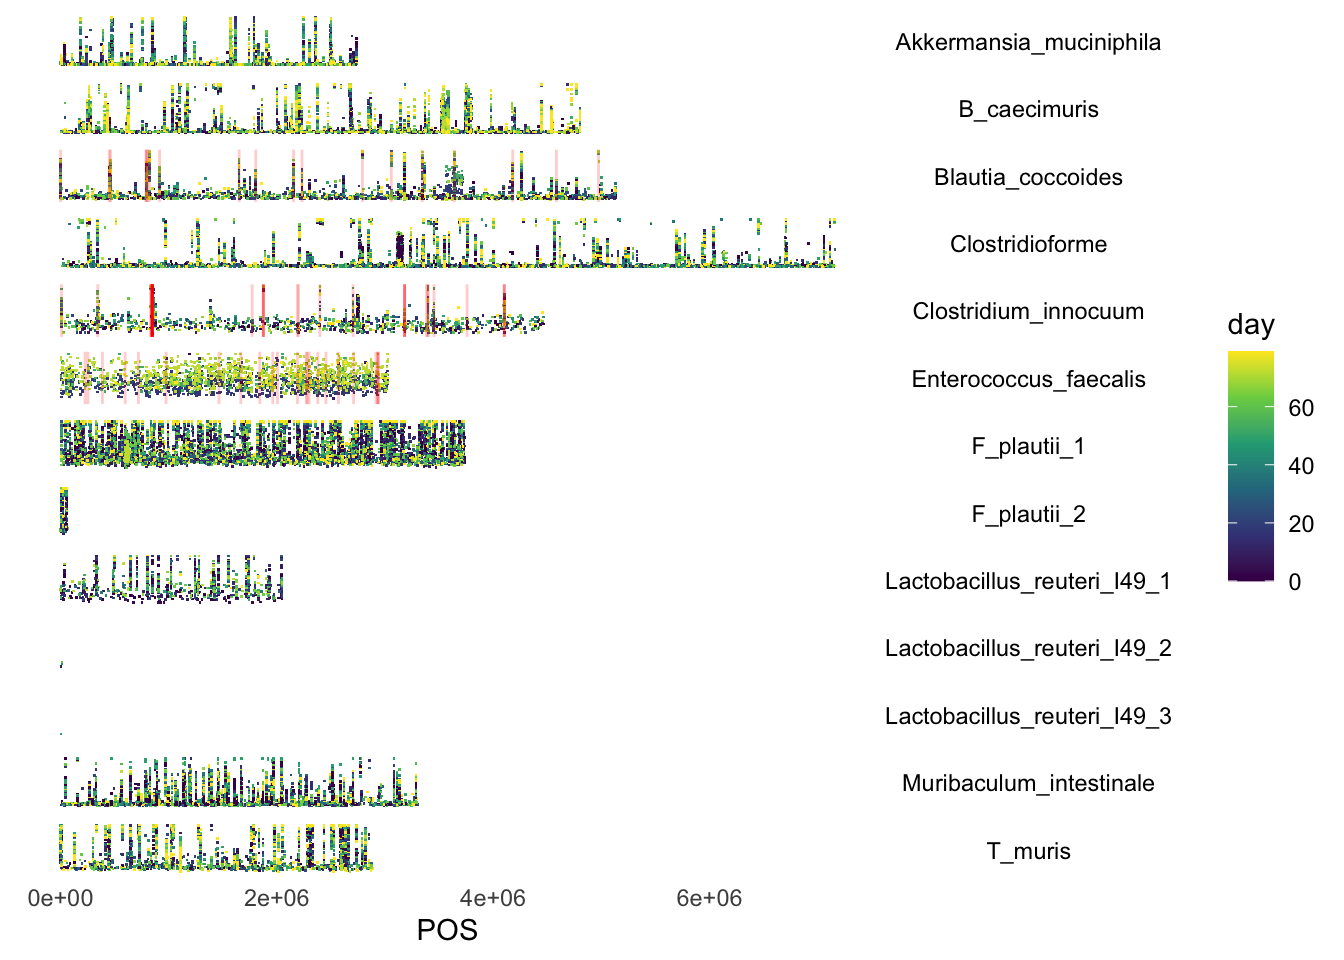
4.11 Humann3
dat <- read.csv2("Humann3/goup_test.tsv", sep = "\t", header = T)
dat$Water <- as.numeric(as.matrix(dat$Water))
dat$Cipro <- as.numeric(as.matrix(dat$Cipro))
dat$Tetra <- as.numeric(as.matrix(dat$Tetra))
dat$Vanco <- as.numeric(as.matrix(dat$Vanco))
dat <- dat[which(dat$Q.value < 0.01), ]## Warning in Ops.factor(dat$Q.value, 0.01): '<' not meaningful for factorsdat <- as.data.frame(dat)
dat$Q.value <- as.numeric(as.matrix(dat$Q.value))
dat$plog <- -log(dat$Q.value)
require(reshape2)
dat.m <- melt(dat, id.vars = c("Short", "Feature", "P.value", "Q.value", "plog"))## Warning in melt(dat, id.vars = c("Short", "Feature", "P.value", "Q.value", : The melt
## generic in data.table has been passed a data.frame and will attempt to redirect to the
## relevant reshape2 method; please note that reshape2 is deprecated, and this redirection is
## now deprecated as well. To continue using melt methods from reshape2 while both libraries
## are attached, e.g. melt.list, you can prepend the namespace like reshape2::melt(dat). In
## the next version, this warning will become an error.p <- ggplot(dat, aes(x = reorder(Feature, plog), y = plog))
p <- p + geom_point() + coord_flip() + theme_minimal()
p
p <- ggplot(dat.m, aes(x = Feature, y = value, color = variable))
p <- p + geom_point(shape = 1) + theme_minimal() + coord_flip()
p <- p + scale_y_log10()
p
4.12 Uniref
dat <- read.table("Humann3/merged_uniref_renorm_annotated_unstratified_mapped.csv", sep = ";",
header = T)
dat <- as.data.frame(dat)
dat$Uniref <- NULL
div <- as.data.frame(vegan::diversity(t(dat), index = "shannon"))
colnames(div) <- "UniRef90"
rownames(div) <- substring(rownames(div), 2)
div$day <- as.integer(substr(rownames(div), 6, 7))
div$mouse.id <- substr(rownames(div), 1, 4)
div$phase <- binDaysByPhase(as.numeric(as.matrix(div$day)))
div$phase_num <- binDaysByPhaseGroup(div$day)
div$mouse.group <- translateMouseIdToTreatmentGroup(div$mouse.id)
div$mouse.id2 <- paste0(div$mouse.id, "_", div$day)
# add qpcr based diversity
qpcr <- read.table("qpcr.csv", header = T, sep = ";")
qpcr$universal <- NULL
rownames(qpcr) <- paste0(qpcr$mouse, "_", qpcr$day)
qpcr <- qpcr[, -c(1:5)]
qpcr <- apply(qpcr, 1, function(x) x/sum(x))
div2 <- as.data.frame(vegan::diversity(t(qpcr), index = "shannon"))
colnames(div2) <- "qpcr_shannon"
div$qpcr <- NULL
div$qpcr <- div2[match(div$mouse.id2, rownames(div2)), ]
div.m <- reshape2::melt(div, measure.vars = c("UniRef90", "qpcr"))
p <- ggplot(div.m, aes(x = day, y = value))
p <- p + geom_point() + theme_minimal()
p <- p + facet_grid(variable ~ mouse.group, scales = "free_y")
p <- p + geom_line() + ylab("Shannon")
p <- p + geom_vline(xintercept = c(4, 18, 53, 67))
p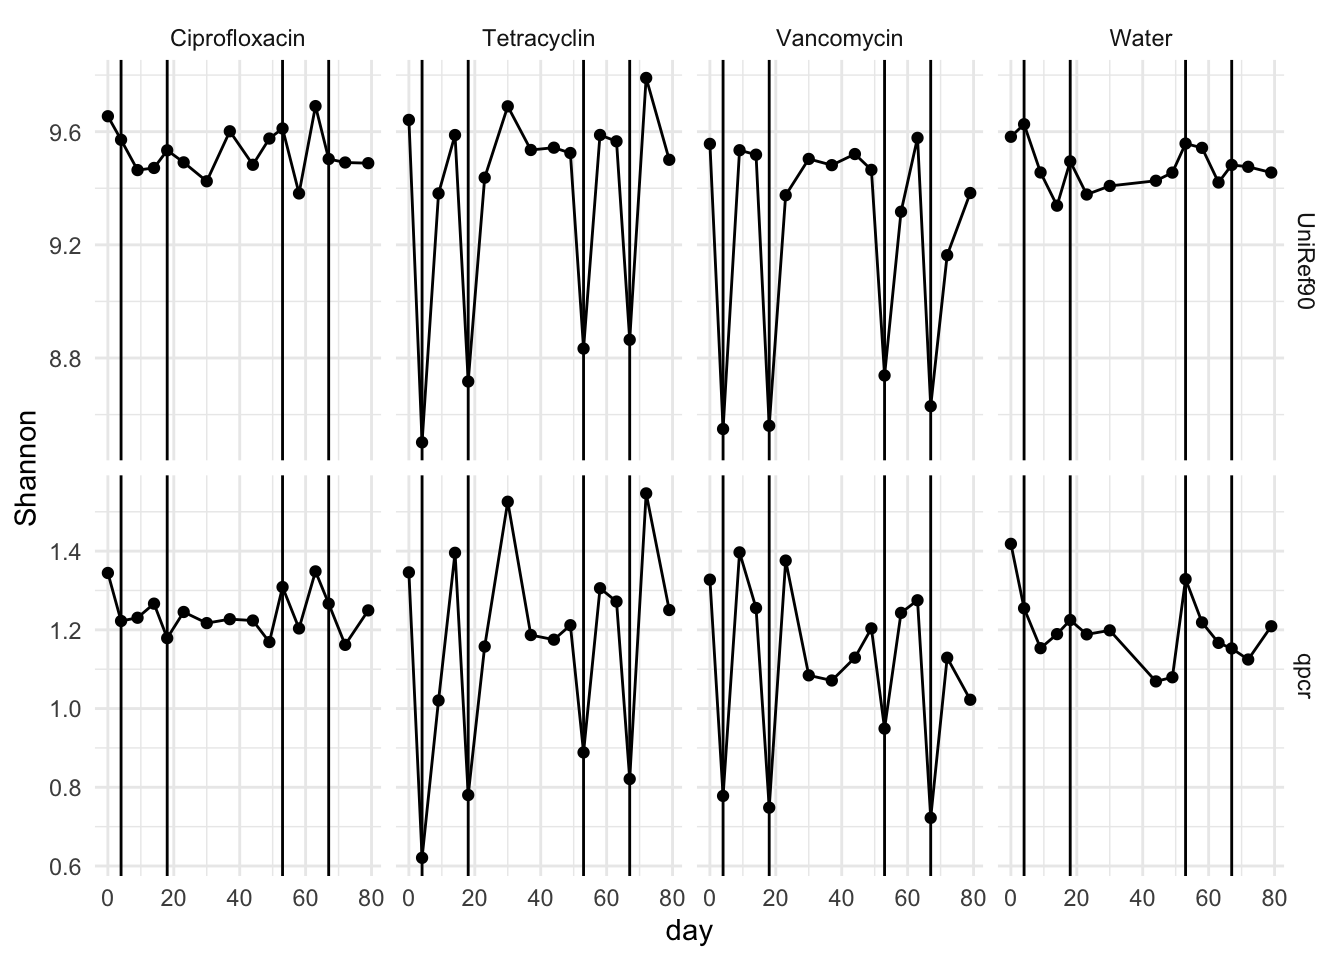
4.13 metaphlan abundance
res <- list()
files <- Sys.glob("Humann3/abundance/*")
for (file in files) {
message(file)
d <- read.table(file, fill = T, header = T)
d$additional_species <- NULL
d$day <- as.integer(substr(basename(file), 6, 7))
d$mouse <- substr(tools::file_path_sans_ext(basename(file)), 1, 4)
d$NCBI_tax_id <- NULL
d <- d[grep("s__", d$clade_name), ]
d$bug <- sapply(strsplit(as.character(as.matrix(d$clade_name)), split = "|", fixed = TRUE),
`[`, 7)
d$clade_name <- NULL
res[[file]] <- d
}## Humann3/abundance/1683d00_S47_R1R2_metaphlan_bugs_list.tsv## Humann3/abundance/1683d04_S48_R1R2_metaphlan_bugs_list.tsv## Humann3/abundance/1683d09_S49_R1R2_metaphlan_bugs_list.tsv## Humann3/abundance/1683d14_S50_R1R2_metaphlan_bugs_list.tsv## Humann3/abundance/1683d18_S51_R1R2_metaphlan_bugs_list.tsv## Humann3/abundance/1683d23_S52_R1R2_metaphlan_bugs_list.tsv## Humann3/abundance/1683d30_S53_R1R2_metaphlan_bugs_list.tsv## Humann3/abundance/1683d44_S55_R1R2_metaphlan_bugs_list.tsv## Humann3/abundance/1683d49_S56_R1R2_metaphlan_bugs_list.tsv## Humann3/abundance/1683d53_S57_R1R2_metaphlan_bugs_list.tsv## Humann3/abundance/1683d58_S58_R1R2_metaphlan_bugs_list.tsv## Humann3/abundance/1683d63_S59_R1R2_metaphlan_bugs_list.tsv## Humann3/abundance/1683d67_S60_R1R2_metaphlan_bugs_list.tsv## Humann3/abundance/1683d72_S61_R1R2_metaphlan_bugs_list.tsv## Humann3/abundance/1683d79_S62_R1R2_metaphlan_bugs_list.tsv## Humann3/abundance/1688d00_S1_R1R2_metaphlan_bugs_list.tsv## Humann3/abundance/1688d04_S2_R1R2_metaphlan_bugs_list.tsv## Humann3/abundance/1688d09_S3_R1R2_metaphlan_bugs_list.tsv## Humann3/abundance/1688d14_S4_R1R2_metaphlan_bugs_list.tsv## Humann3/abundance/1688d18_S5_R1R2_metaphlan_bugs_list.tsv## Humann3/abundance/1688d23_S6_R1R2_metaphlan_bugs_list.tsv## Humann3/abundance/1688d30_S7_R1R2_metaphlan_bugs_list.tsv## Humann3/abundance/1688d37_S8_R1R2_metaphlan_bugs_list.tsv## Humann3/abundance/1688d44_S9_R1R2_metaphlan_bugs_list.tsv## Humann3/abundance/1688d49_S10_R1R2_metaphlan_bugs_list.tsv## Humann3/abundance/1688d53_S11_R1R2_metaphlan_bugs_list.tsv## Humann3/abundance/1688d58_S12_R1R2_metaphlan_bugs_list.tsv## Humann3/abundance/1688d63_S13_R1R2_metaphlan_bugs_list.tsv## Humann3/abundance/1688d67_S14_R1R2_metaphlan_bugs_list.tsv## Humann3/abundance/1688d72_S15_R1R2_metaphlan_bugs_list.tsv## Humann3/abundance/1688d79_S16_R1R2_metaphlan_bugs_list.tsv## Humann3/abundance/1692d00_S17_R1R2_metaphlan_bugs_list.tsv## Humann3/abundance/1692d04_S18_R1R2_metaphlan_bugs_list.tsv## Humann3/abundance/1692d09_S19_R1R2_metaphlan_bugs_list.tsv## Humann3/abundance/1692d14_S20_R1R2_metaphlan_bugs_list.tsv## Humann3/abundance/1692d18_S21_R1R2_metaphlan_bugs_list.tsv## Humann3/abundance/1692d23_S22_R1R2_metaphlan_bugs_list.tsv## Humann3/abundance/1692d30_S23_R1R2_metaphlan_bugs_list.tsv## Humann3/abundance/1692d37_S24_R1R2_metaphlan_bugs_list.tsv## Humann3/abundance/1692d44_S25_R1R2_metaphlan_bugs_list.tsv## Humann3/abundance/1692d49_S26_R1R2_metaphlan_bugs_list.tsv## Humann3/abundance/1692d53_S27_R1R2_metaphlan_bugs_list.tsv## Humann3/abundance/1692d58_S28_R1R2_metaphlan_bugs_list.tsv## Humann3/abundance/1692d63_S29_R1R2_metaphlan_bugs_list.tsv## Humann3/abundance/1692d67_S30_R1R2_metaphlan_bugs_list.tsv## Humann3/abundance/1692d72_S31_R1R2_metaphlan_bugs_list.tsv## Humann3/abundance/1692d79_S32_R1R2_metaphlan_bugs_list.tsv## Humann3/abundance/1699d00_S33_R1R2_metaphlan_bugs_list.tsv## Humann3/abundance/1699d04_S34_R1R2_metaphlan_bugs_list.tsv## Humann3/abundance/1699d09_S35_R1R2_metaphlan_bugs_list.tsv## Humann3/abundance/1699d14_S36_R1R2_metaphlan_bugs_list.tsv## Humann3/abundance/1699d18_S37_R1R2_metaphlan_bugs_list.tsv## Humann3/abundance/1699d23_S38_R1R2_metaphlan_bugs_list.tsv## Humann3/abundance/1699d30_S39_R1R2_metaphlan_bugs_list.tsv## Humann3/abundance/1699d37_S40_R1R2_metaphlan_bugs_list.tsv## Humann3/abundance/1699d44_S41_R1R2_metaphlan_bugs_list.tsv## Humann3/abundance/1699d49_S42_R1R2_metaphlan_bugs_list.tsv## Humann3/abundance/1699d53_S63_R1R2_metaphlan_bugs_list.tsv## Humann3/abundance/1699d58_S64_R1R2_metaphlan_bugs_list.tsv## Humann3/abundance/1699d63_S65_R1R2_metaphlan_bugs_list.tsv## Humann3/abundance/1699d67_S66_R1R2_metaphlan_bugs_list.tsv## Humann3/abundance/1699d72_S67_R1R2_metaphlan_bugs_list.tsv## Humann3/abundance/1699d79_S68_R1R2_metaphlan_bugs_list.tsvrequire(ggplot2)
library(RColorBrewer)
df$group <- translateMouseIdToTreatmentGroup(df$mouse)
mycolors <- colorRampPalette(brewer.pal(8, "Dark2"))(length(unique(df$bug)))
df$sample <- paste0(df$mouse, "_", df$day)
p <- ggplot(df, aes(x = day, y = relative_abundance, fill = bug))
p <- p + facet_grid(. ~ group, )
p <- p + geom_bar(stat = "identity") + theme_minimal() + scale_fill_manual(values = mycolors)
p <- p + theme(axis.text.x = element_text(angle = 90, hjust = 1))
p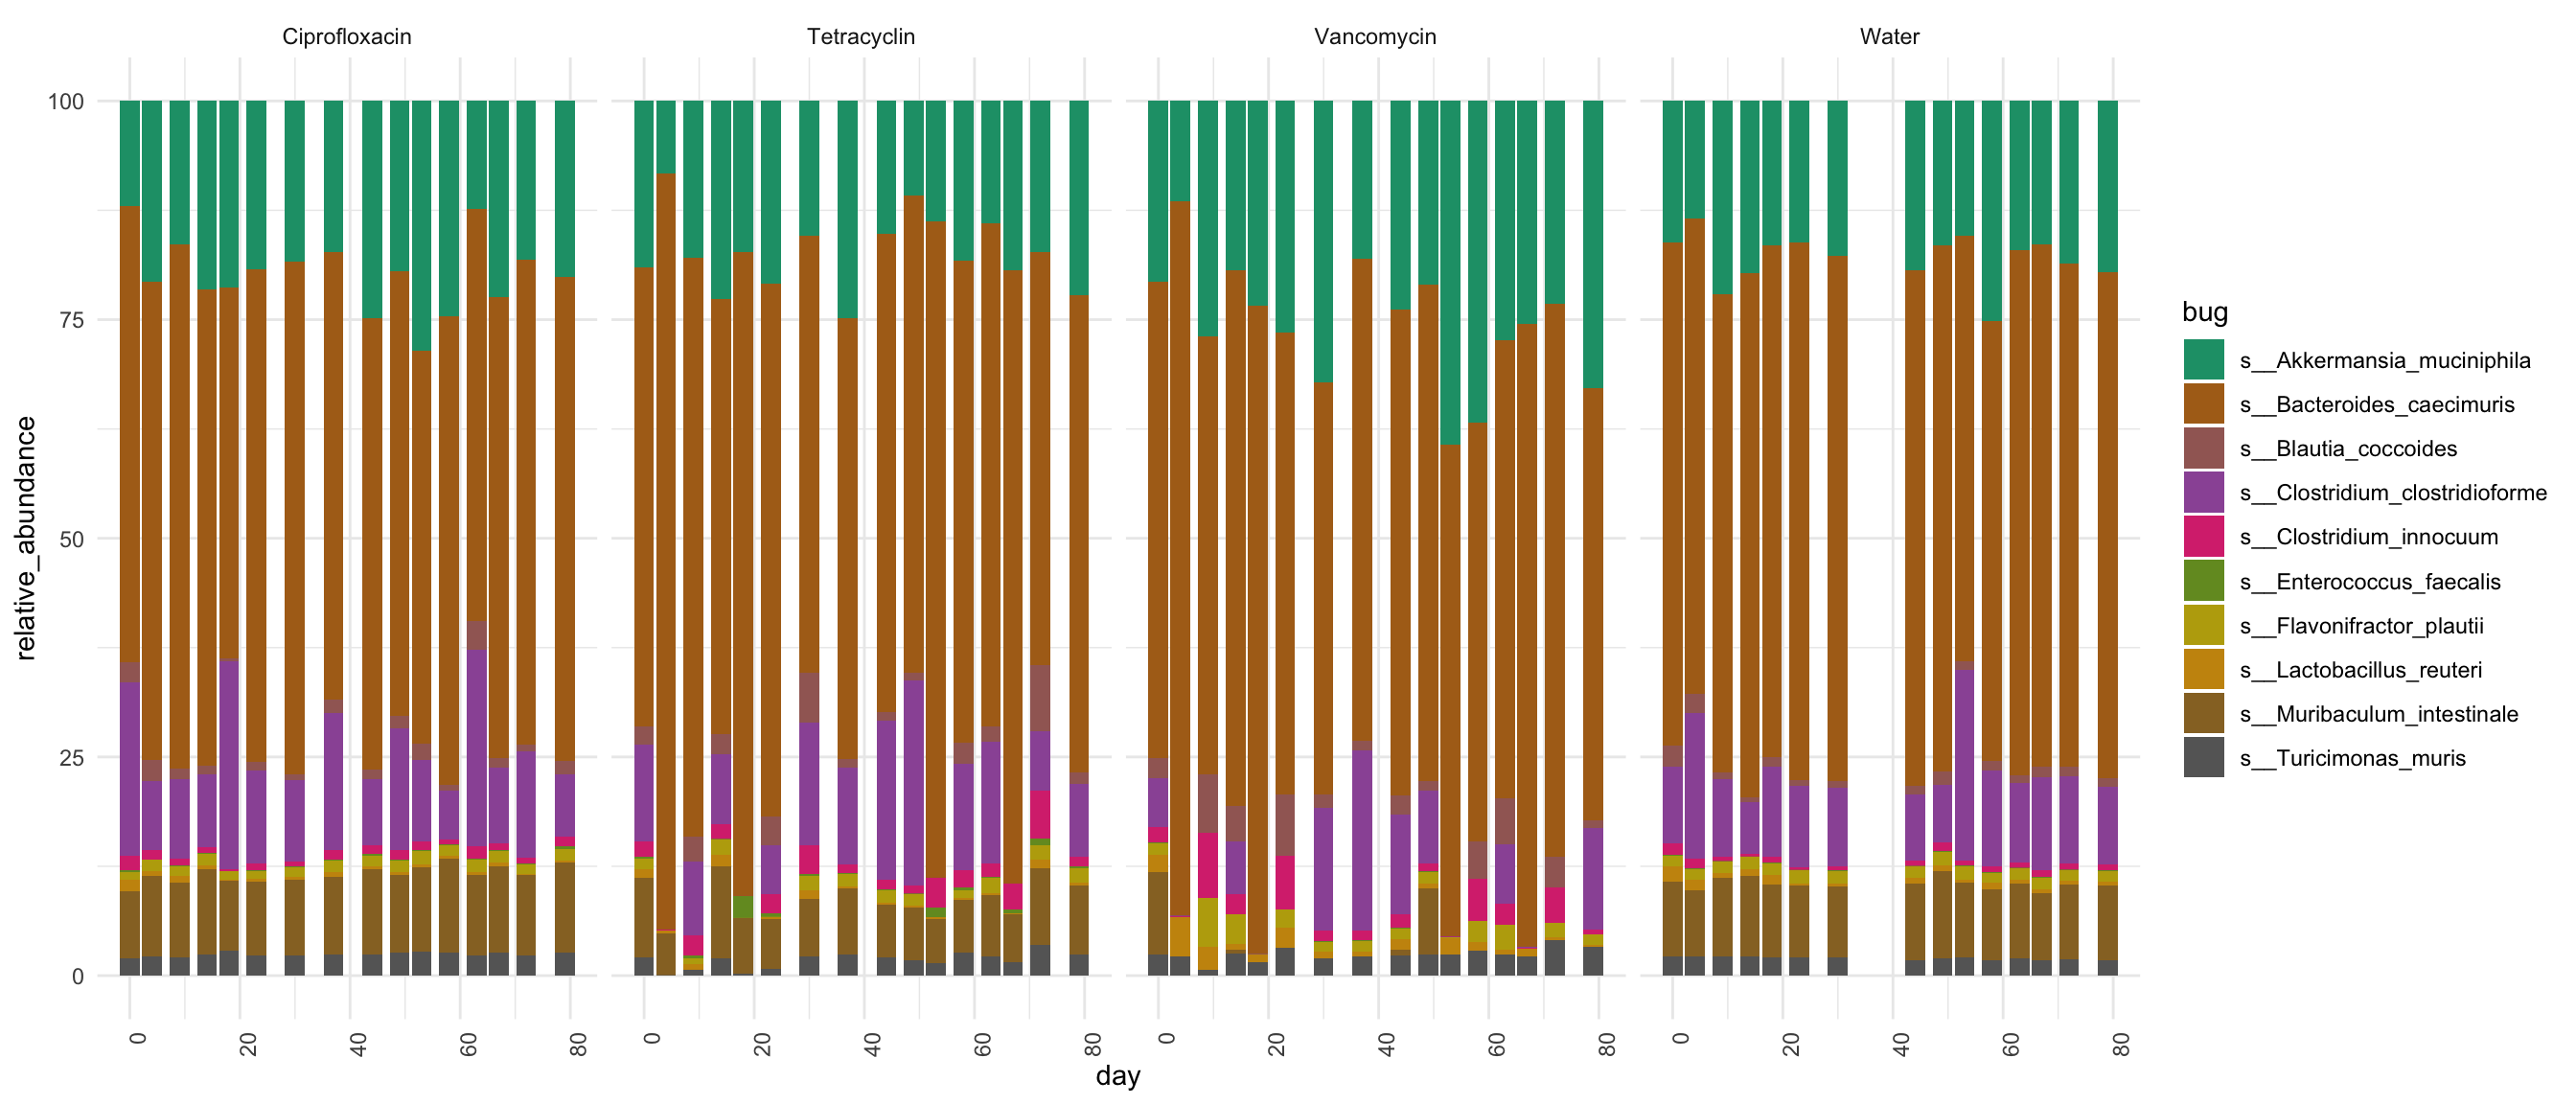
## Warning in dcast(df, bug ~ sample, value.var = "relative_abundance"): The dcast
## generic in data.table has been passed a data.frame and will attempt to redirect to the
## reshape2::dcast; please note that reshape2 is deprecated, and this redirection is now
## deprecated as well. Please do this redirection yourself like reshape2::dcast(df). In the
## next version, this warning will become an error.rownames(data.wide) <- data.wide$bug
data.wide$bug <- NULL
data.wide[is.na(data.wide)] <- 0
div3 <- as.data.frame(vegan::diversity(t(data.wide), index = "shannon"))
div$metaphlan <- div3[match(div$mouse.id2, rownames(div3)), ]
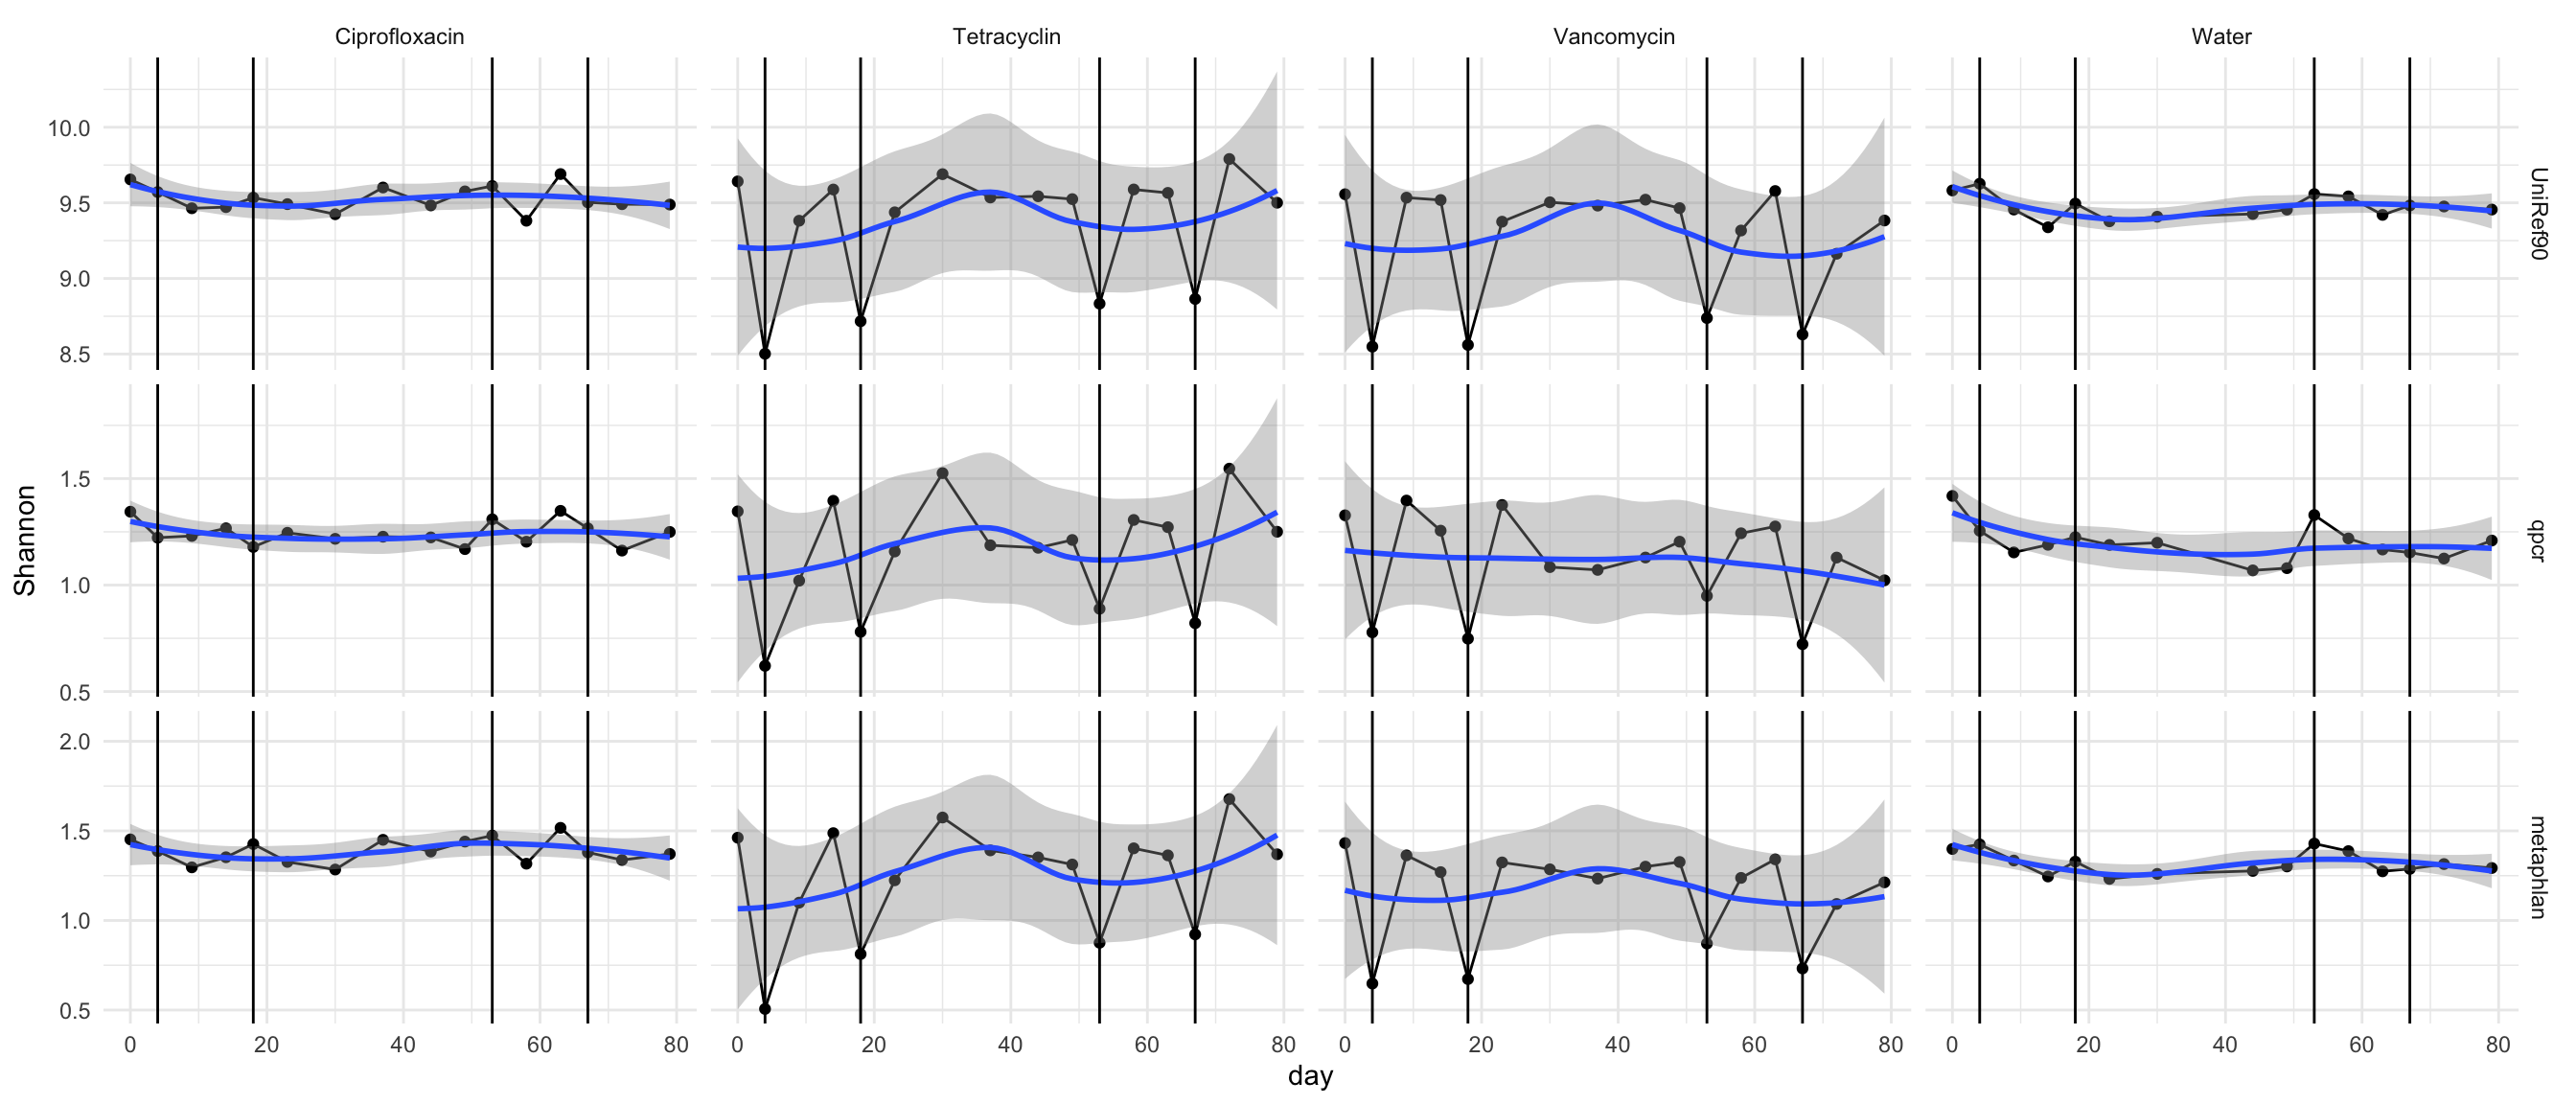
div.m <- reshape2::melt(div, measure.vars = c("UniRef90", "qpcr", "metaphlan"))
p <- ggplot(div.m, aes(x = day, y = value))
p <- p + geom_point() + theme_minimal()
p <- p + facet_grid(variable ~ mouse.group, scales = "free_y")
p <- p + geom_line() + ylab("Shannon")
p <- p + geom_smooth()
p <- p + geom_vline(xintercept = c(4, 18, 53, 67))
p## `geom_smooth()` using method = 'loess' and formula 'y ~ x'